
Tag: clayton aldern
RJI Fellows reflect on eight month projects, what they’ve learned and how the industry can benefit
Seven fellows at the Donald W. Reynolds Journalism Institute who have been working on innovative projects that can benefit the journalism industry, over the past eight months, are wrapping up their projects. Six shared findings and insights from their projects, as well as links to resources during a recent Q&A webinar with the public. We’ve … Continued

How to build data capacity in your newsroom
Introducing DUG, our beta data unit guide Forget the gist of the photo up there—the one reading “data has a better idea.” I don’t buy it. (Lovely photo though, no?) Data rarely has a better idea, because data doesn’t think. People think. Sometimes data can help people think a little better. The problem is that … Continued

How visual metaphor helps move our data off the page
And into people’s brains It’s a new year, and as I’m nearing the end of this fellowship, it seems worth pulling the lens back a bit. We’ve spent a lot of time thinking about nuts and bolts —how to build a bot, when to opt for quick and dirty hacks over fresh code, if and … Continued
Pre-reporting for data journalists
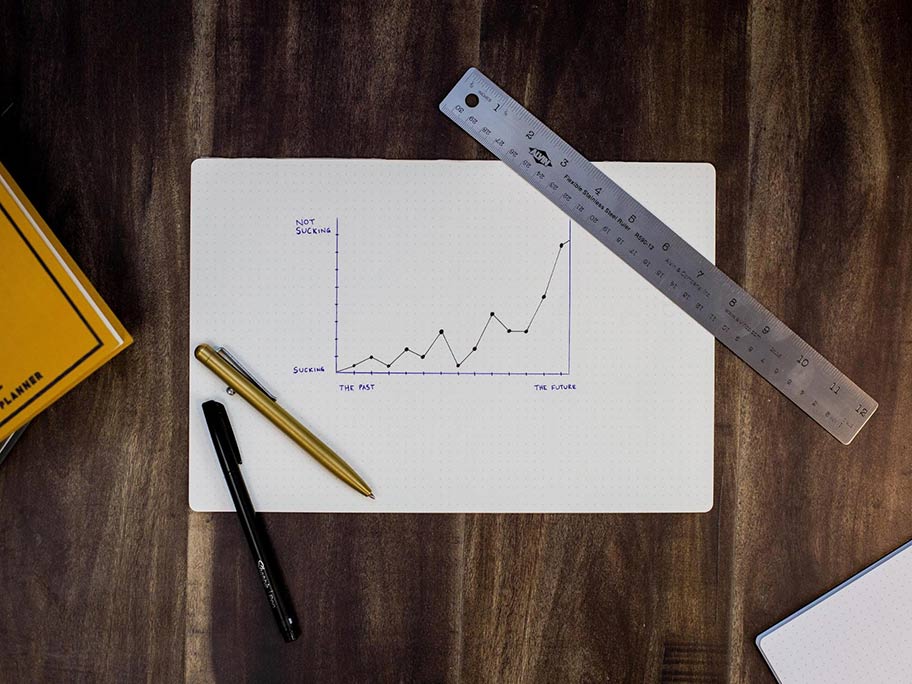
A brief intro to exploratory analysis In a recent paper, a pair of statisticians took a stab at outlining “the most important statistical ideas of the past 50 years.” Among them: “counterfactual causal inference, bootstrapping and simulation-based inference, overparameterized models and regularization, multilevel models, generic computation algorithms, adaptive decision analysis, robust inference, and exploratory data … Continued

Reynolds Journalism Institute fellows to present overviews of their projects
Fellows will discuss what they learned and answer questions about their projects during the webinar. The Donald W. Reynolds Journalism Institute’s 2020-2021 fellows will present an overview of their projects on Tuesday, Feb. 16 beginning 11 a.m. CST. Six fellows will discuss their project and what they learned, how they accomplished their goals, and share … Continued
When journalists should care about p-values
And when they shouldn’t There’s a saying in statistics: “All models are wrong, but some are useful.” In other words, it’s a little quixotic to imagine we can capture the nuances of reality with simple models, but some of these models can make the complex more legible. The first chunk of the saying is the … Continued

Your first web-scraping project will be easier than you think
Last week, a colleague emailed me with a data request. She was working on a story about the shifting sands of Republican congressional rhetoric on climate change and was wondering if GOP voting records had seen any corresponding shifts in recent years. She pointed out that one good measure of environmental voting comes from the … Continued
Scrappy hacks for scrappy visual journalists
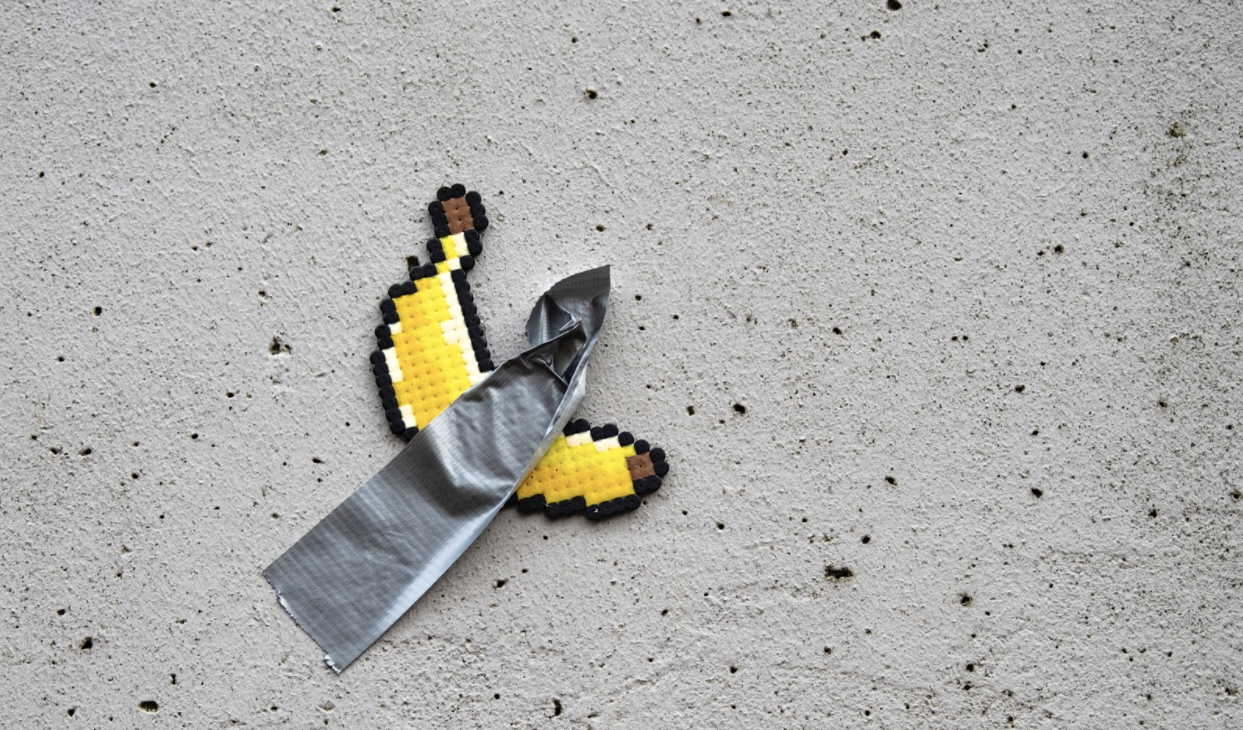
As far as I can tell, the Internet is mostly duct-taped together. And why should visual journalism be any different? In a world of flashy D3.js wrappers and React components and the like, sometimes you just need a chart—and you need it as quickly as possible. In other words, you don’t need interactivity; you need … Continued
Build a real-time dataviz bot (for free!)
When it’s not busy playing host to cryptocurrency scams, Twitter remains a widely adopted platform for the distribution of bite-sized information. For that reason alone, it’s well-suited to sharing real-time data—especially via charts and graphics.

The promise of environmental data journalism
Over the course of this RJI fellowship, I’m working with the nonprofit environmental magazine Grist to think through what it’d mean to build out a national environmental data-journalism unit—and, in turn, to take what we learn at Grist and translate these lessons into guides for other small or nonprofit newsrooms that might find themselves interested in similar work.