Tag: health
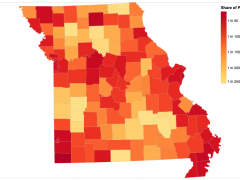
Mapping COVID-19 cases in Observable with Vega-Lite
Choropleth maps show how data varies across a geographic region, a visualization technique used often to present a wide variety of data, including economic data, election results and, more recently, the prevalence of COVID-19 cases and deaths. I recently created a choropleth map that pulls live county-level COVID-19 case data from the Missouri Department of … Continued