Tag: observable
The people behind the data points
Weihua Li of the Marshall Project balances the severity and humanity of incarceration through data.
Building interactive visual experiences from data
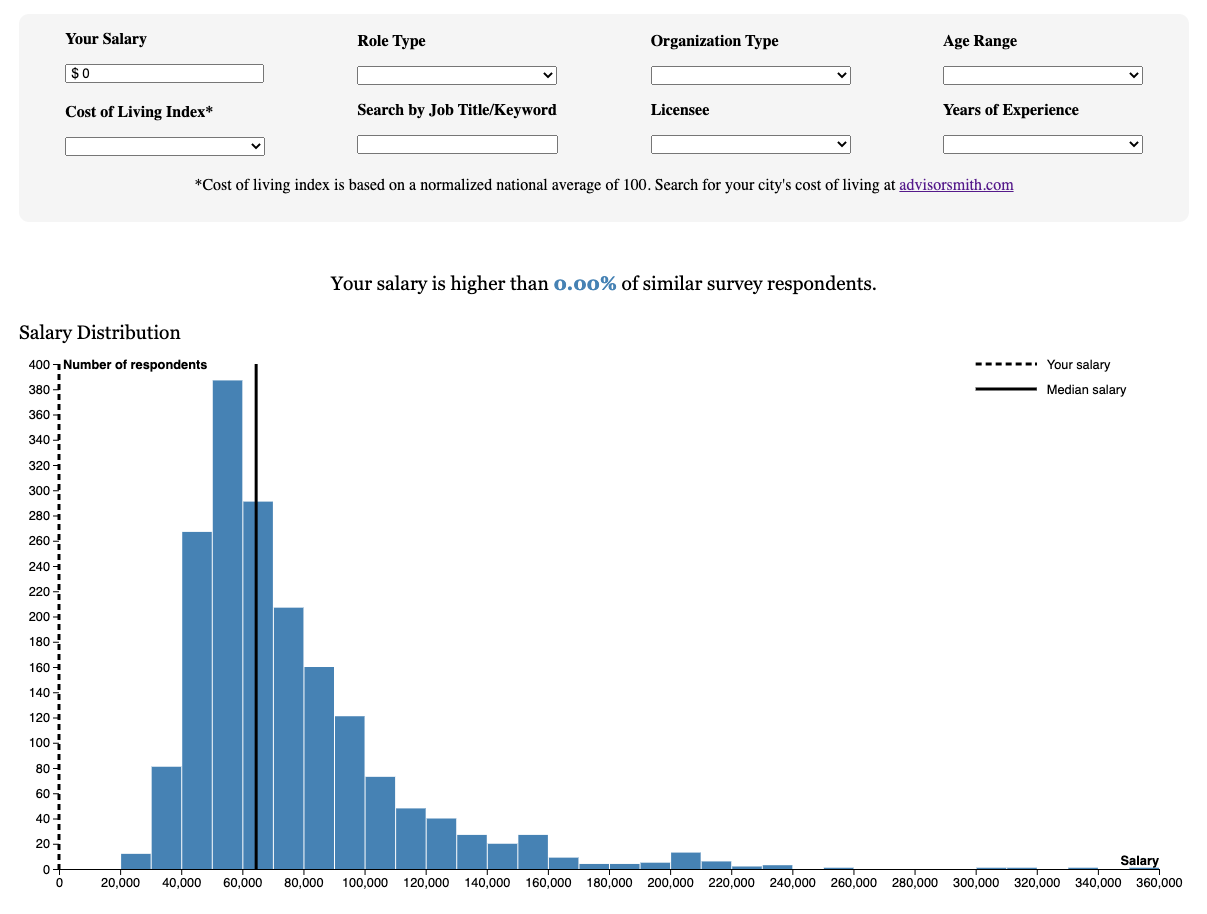
How we helped the Current analyze and visualize public salary data.
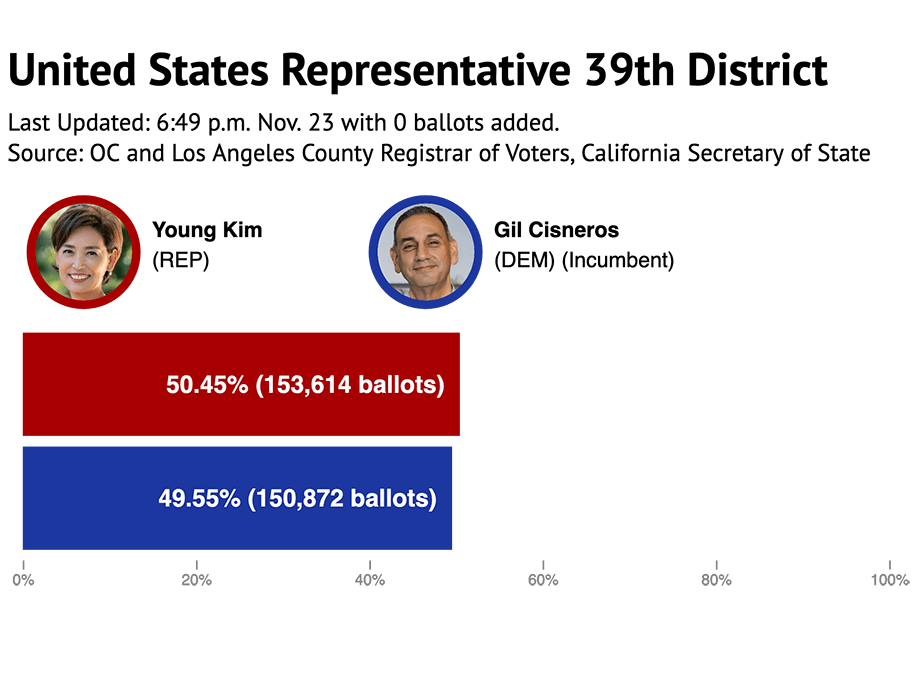
Automating election results from local data sources
We teamed up with the Voice of OC, a non-profit, local news site in Orange County, California, to automate their live election results. We teamed up with the Voice of OC, a non-profit, local news site in Orange County, California, to automate their live election results. By integrating data from several authorities, we provided up-to-the-minute … Continued
Mapping COVID-19 cases in Observable with Vega-Lite
Choropleth maps show how data varies across a geographic region, a visualization technique used often to present a wide variety of data, including economic data, election results and, more recently, the prevalence of COVID-19 cases and deaths. I recently created a choropleth map that pulls live county-level COVID-19 case data from the Missouri Department of … Continued
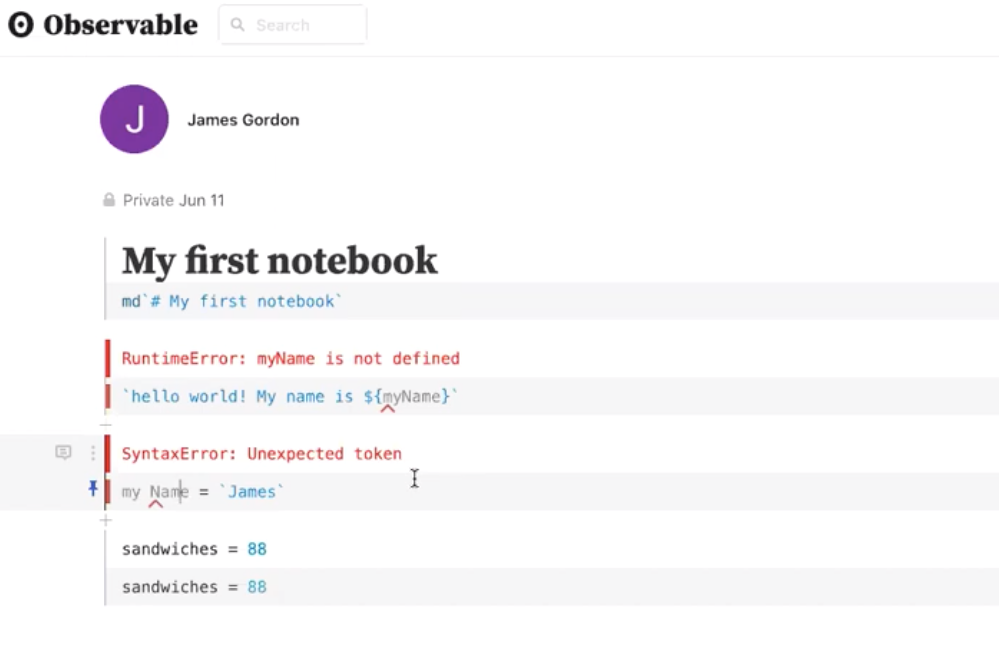
Visualizing COVID-19 data: Learning Observable and Vega
Watch this workshop for journalists to learn how to visualize COVID-19 data with these two web tools


