
Solutions for auditing sources in small newsrooms

Including tools and strategies to evaluate geographic diversity of coverage
Cristal Sanchez is a 2025 RJI Student Innovation Fellow partnered with Spotlight Delaware. The RJI Student Fellows will be sharing their innovative work throughout the summer in Innovation in Focus.
Spotlight Delaware is a startup nonprofit newsroom that has been distributing local news throughout the state of Delaware for a little more than a year. Part of the newsroom’s mission is to connect with local residents, especially those in the state’s southern rural counties. To measure Spotlight Delaware’s coverage throughout the state, we conducted a geographic audit. We also compared alternative methods for conducting demographic audits at a low-cost scale.
Identifying which areas of the state were being covered
We decided to conduct a manual geographic audit. One newsroom staff was in charge of inputting the article URLs into the spreadsheet and another was in charge of analyzing the articles. We used a Google Spreadsheet to keep track of whether the article was about Delaware, a specific county or counties and if any specific cities or towns played a large part in the story. Since the startup newsroom only had a total of 432 stories (editorial letters and sponsored stories excluded), this was doable and only took a staff member about 2 weeks to complete.
Newsrooms can follow this template.
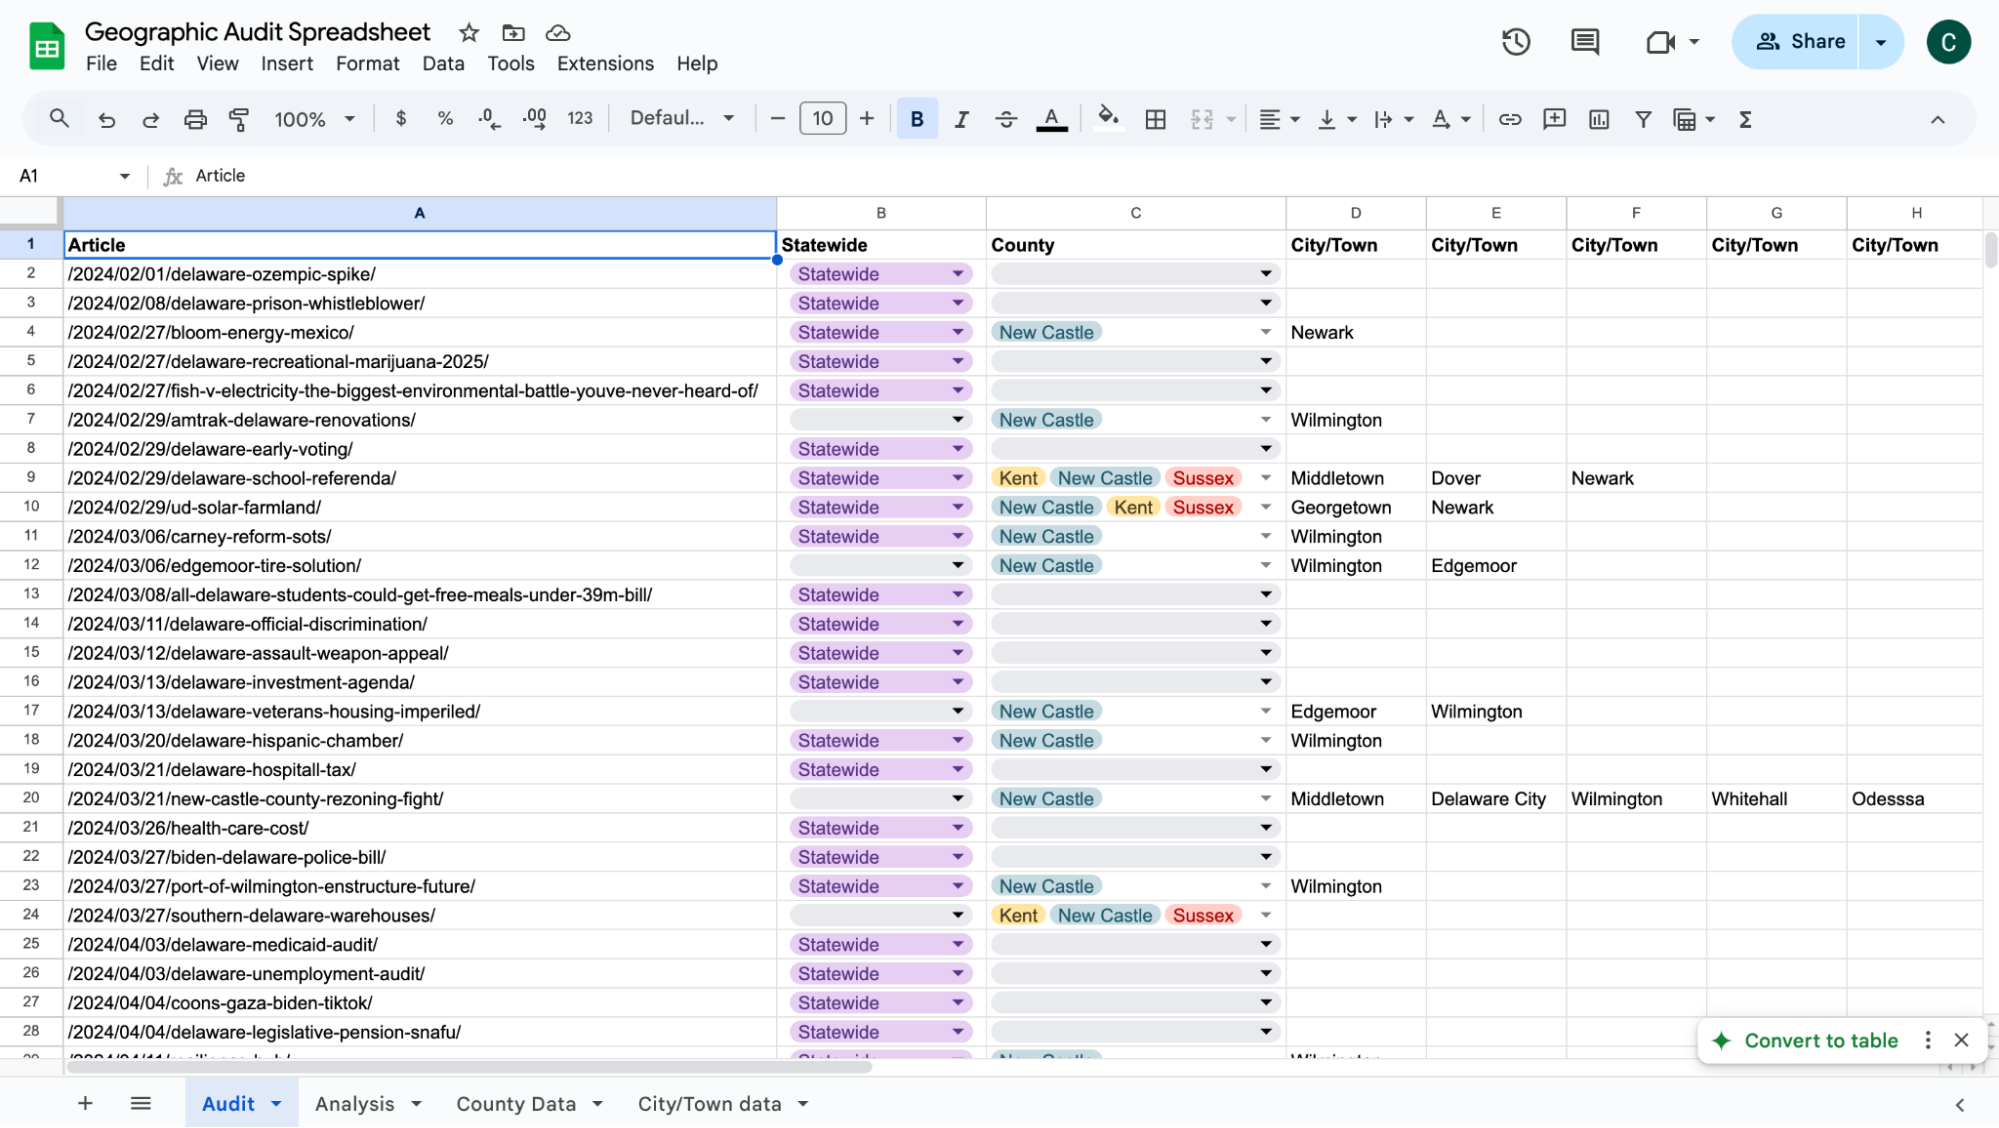
To extract the data, we used the “column stats” feature under the “Data” tab in Google Sheets to determine how many times a story was from a specific region. A count of how many stories were related to a certain region is automatically made available, and you can immediately see where most of your coverage comes from. This feature compiles data from each row.
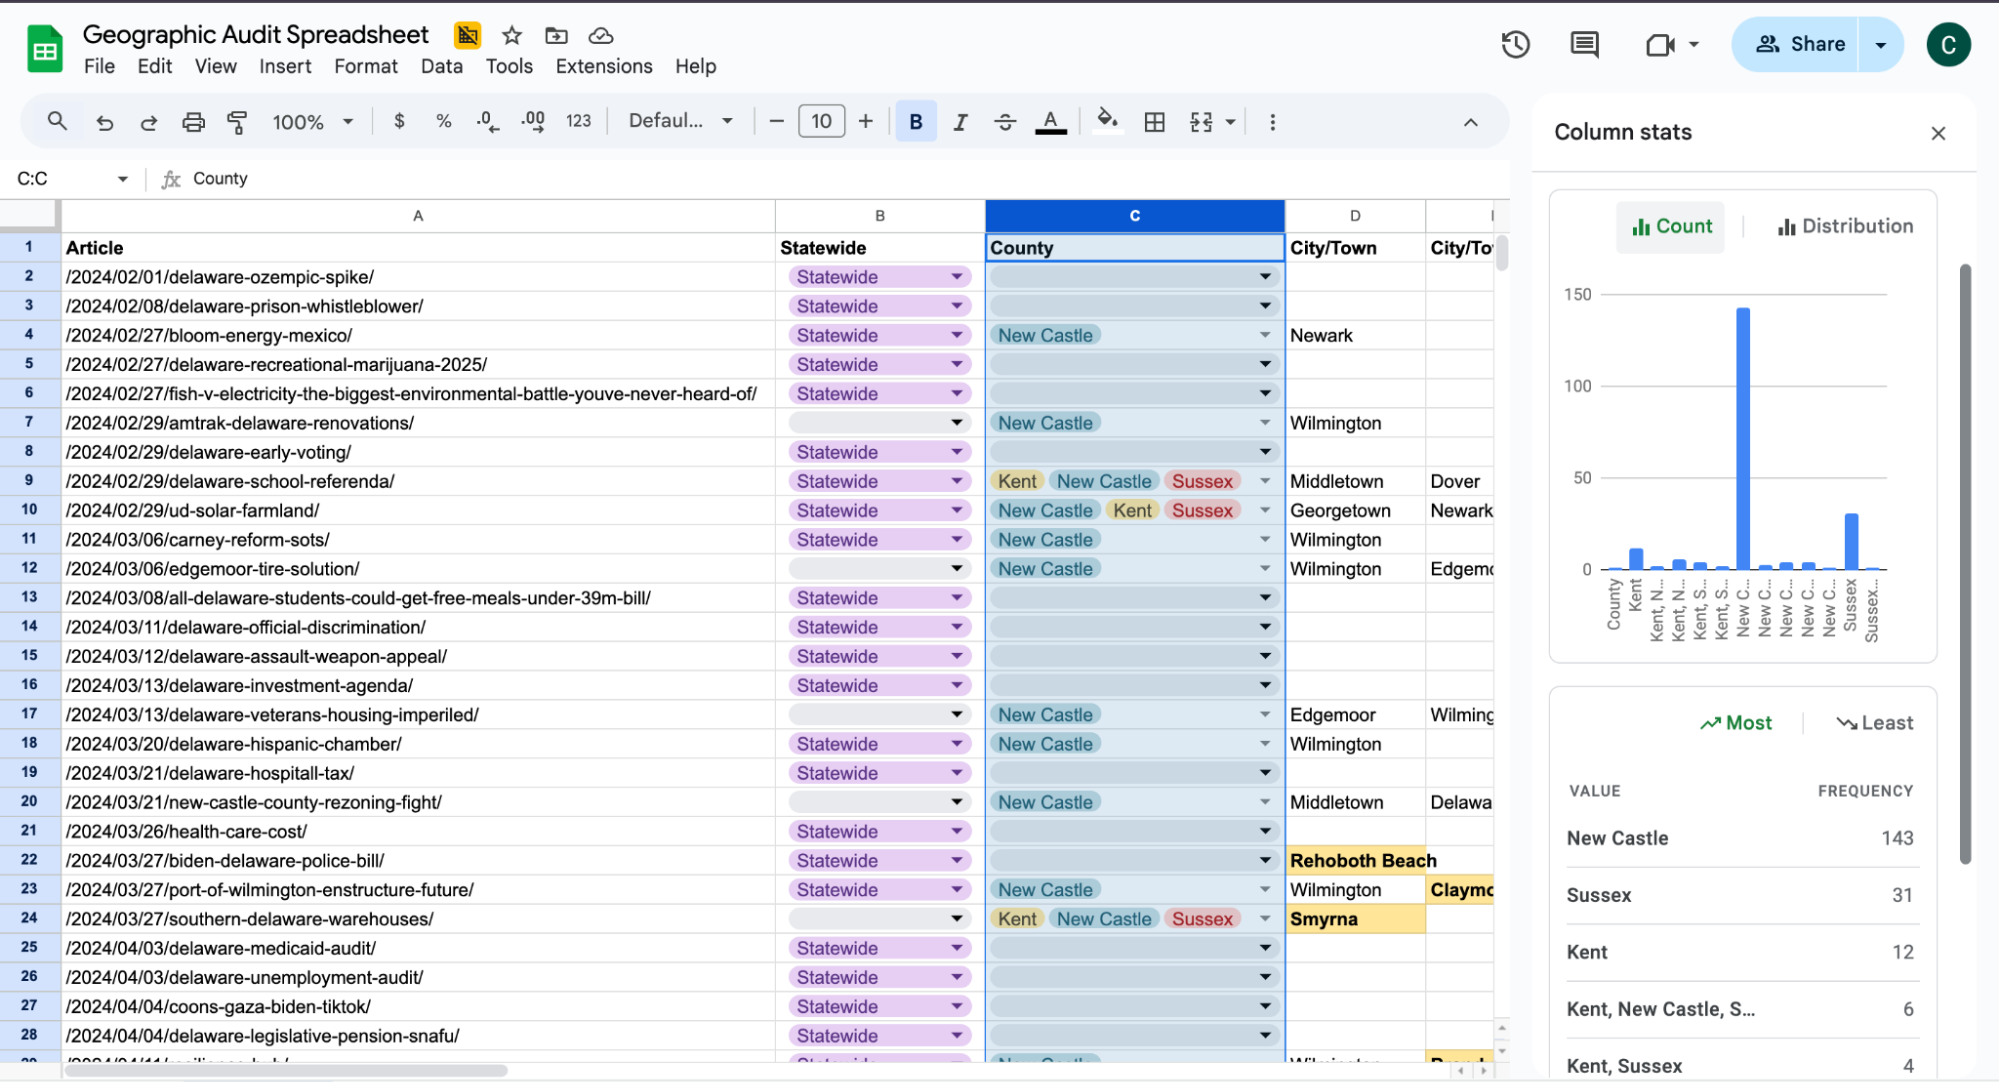
Our results showed that 300 out of 431 of Spotlight Delaware’s stories applied to a statewide audience. We also determined that most stories covered only the northernmost part of the state.
This data will be made public and will be communicated internally. The goal is to be transparent about Spotlight Delaware’s progress toward its mission and identify gaps in our coverage. To make this information more digestible, we visualized the data using Datawrapper. Below are drafts of the two publishable maps.
We plan for the maps to be accompanied by a written article with percentages and a deeper analysis of the strengths and weaknesses in Spotlight Delaware’s coverage. Already, the organization has recognized more focus is needed in the central and southern counties and had already planned to hire a reporter to cover these counties before the audit was performed.
How to do this with a larger story archive
We realize this manual approach may not be realistic for all newsrooms who do not have an extra staff member to code all stories. To make this process more sustainable we’ve brainstormed a couple of solutions:
- Look into the past: choose a randomized sample of news articles to access. This could mean analyzing a month’s worth of stories instead of a year.
- Note here that coding all of your state’s cities and towns mentioned in your coverage may also not be feasible, especially if you are a statewide newsroom. Consider dividing your state into certain regions and grouping some counties together to facilitate data analyzation.
- Plan for the future: collect demographic data as part of a larger source audit to determine geographic data as you progress.
The latter is a solution Spotlight Delaware is interested in taking to make this geographic audit sustainable.
Different types of source audits: Pros and cons
In addition to acquiring geographic data of our coverage, we are also interested in collecting demographic data of our sources. Source audits are not new and there are already plenty of free resources available such as the tool created by RJI and Chalkbeat.
To find the most cost-efficient tool that would not require too much time from our reporters and could also generate reliable data, we researched case studies and interviewed different newsrooms.
Option 1: A retroactive source audit
- Firms such as Impact Architects code a randomized sample of stories to determine the demographics of stories. The service comes with an estimated cost of $250 an hour and can take about 6 months, according to a demonstration with Impact Architects.
- The Scope in Boston is a hyperlocal newsroom that is experimenting with ChatGPt’s “gpt-3.5-turbo” model to determine the demographics of sources in news stories. The team prompts Chat GPT with a plethora of prompts that spit out demographic data that they then manually clean up. Below is a diagram of the prompts:
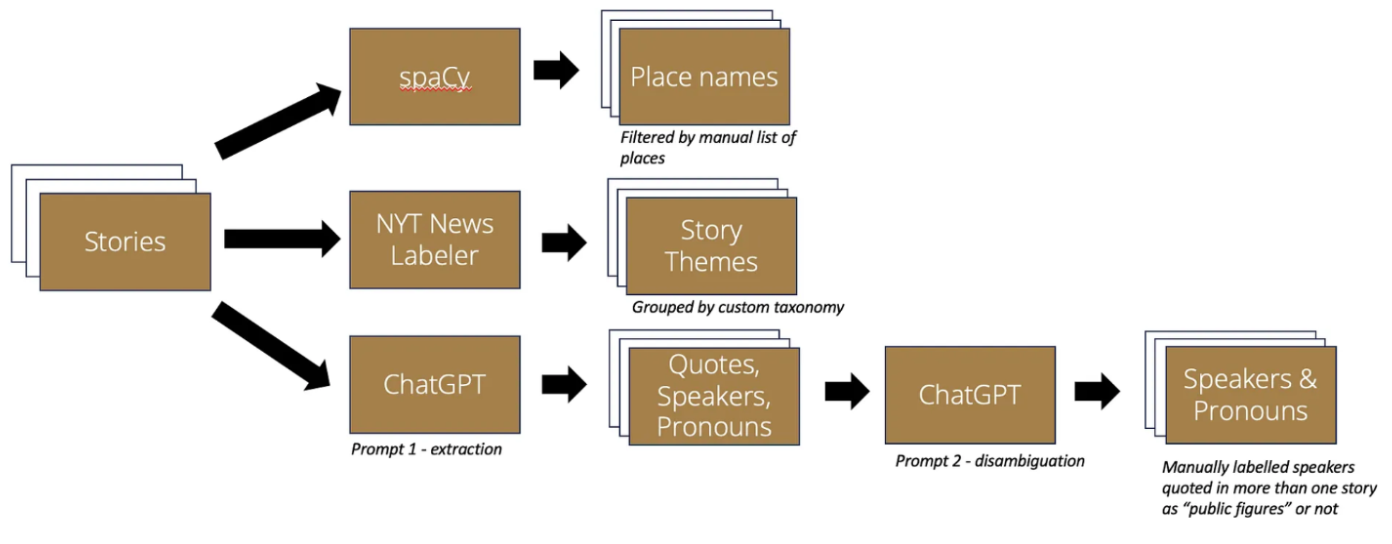
Demographic data can even be broken down into story beats. This is a more affordable alternative than hiring a firm. The upgraded AI tool which is more safeguarded against “hallucinations” and claims to be more thorough in collecting data. The cost was only $6 total for the roughly 700 stories coded.
- Other newsrooms such as the KUT radio station contracted a part time employee to code over 600 stories and pull out demographic information. If the employee had trouble determining the data, they would work with the journalists.
Option 2: A proactive source audit
- The RJI-Chalkbeat tool allows newsrooms to send surveys to sources with demographic questions after an interview. The questions can be customized to fit newsroom needs and the tool protects source privacy by not linking them to an email or even a name if the person doesn’t want to provide it. It also centers accuracy by collecting the information directly from the source, while not putting them on the spot during an in-person interview where they may feel obligated to give the information to the reporter.
- Indiana Public Broadcasting has built a Google folder with sample templates for journalists to fill out a Google form after they have asked demographic questions at the end of interviews. The questions can be customized to fit newsroom needs. In an interview with Lauren Chapman, the digital editor for the station, we found out the response rate is substantially higher than sending out surveys. When asked about how reporters felt in asking these questions, she said it’s a valid concern but sources are actually more open if you reveal why you are collecting information. In the five years she has collected the data, she said only a small handful have declined to provide their demographics.
Although the first option would be the most time-efficient and doesn’t put a burden on the newsroom, we worry about assuming demographic information, whether it comes from AI or an individual. Stereotypes may be used throughout the process, thus raising ethical concerns.
The second option would need more legwork from newsrooms, but it builds a system in place for the auditing to become a habit. In the long run, the newsroom could analyze the data annually. We plan on having multiple meetings with the editorial team and reporters to determine the best option.

Sign up for the Innovation in Focus Newsletter to get our articles, tips, guides and more in your inbox each month!
Cite this article
Sanchez, Cristal (2025, July 10). Solutions for auditing sources in small newsrooms. Reynolds Journalism Institute. Retrieved from: https://rjionline.org/news/solutions-for-auditing-sources-in-small-newsrooms/