
Tables and charts in Excel demonstrate the changing percentage of people 65 and over in Lake County California compared to the adjusted death rate in the same time frame.
Going beyond local data to contextualize a community issue

Tools and advice for finding and analyzing data in rural Lake County, California
Laine Cibulskis is a 2023 RJI Student Innovation Fellow partnered with Lake County News in California. The RJI Student Fellows will be sharing their innovative work through Innovation in Focus.
Elizabeth Larson, editor, publisher, and chief reporter for Lake County News in California, noticed friends dying from rare cancers. Given Lake County’s frequent encounters with severe wildfires, especially in recent years, rising death rates from cancers and respiratory diseases wouldn’t be out of the ordinary. We started diving into the data behind mortality rates and wildfires to see if death rates are increasing or are typical within the context of the current conditions.
Here is how we found, cleaned, organized and used data to direct and contextualize our reporting.
How we identified the fire data needed for context — and tools that helped
To get some initial context, we started looking at wildfire statistics from Cal Fire. Also known as the California Department of Forestry and Fire Protection, Cal Fire responds to fires and other emergencies, with a mission of protecting people, property and resources.
Because publicly accessible data is often buried within government websites that weren’t built as data portals, it can be easier to search for the data on Google than attempt to navigate those sites.
When I searched “california fire data by county” in Google, for example, Cal Fire’s statistics page appeared first.

At the bottom of Cal Fire’s statistics page, we found multiple PDFs of past wildfire activity statistics (also known as Redbooks) for every year since 2008.
In each Redbook (from 2008-2021), we found several measures of fire impact: number of fires by county, number of acres burned by county, dollar damage by county, among others.
We ultimately decided to focus on the measure “acres burned” as it sheds light on the total area burned each year, not just the number of fires. For example, two counties could each have 15 fires in a season, but the amount of area actually affected could vary immensely.
One major caveat to the Redbooks: the data is only available in PDF form. It wasn’t too much trouble since we were only taking one piece of data from each report (total acres burned in Lake County), but if you’re looking to extract more data from a PDF, some tools can help.
Tabula is a free, easy-to-use option that can convert data in tables from PDFs into Excel and CSV files. Another option, Tableau, though paid and more difficult to use, can create customized tables and visualizations from data in PDFs. But for most projects, like this one, tools like Excel and Google Sheets can be sufficient to organize and analyze data.
Another roadblock was the lack of historical fire data by county pre-2008. Larson is still working with a contact from Cal Fire to get data going back to 1970, which is where we started looking at mortality so we could have 50 years of data to explore. It would also match with the earliest data California Health and Human Services provides on total death statistics. However, what’s available online often cannot tell the entire story. Reaching out to the organizations that house data can help fill in the blanks.
Finding and collecting data related to mortality rates
After we collected all the acreage data onto an Excel spreadsheet, we started looking at the death outcomes in the same timespan of the wildfire data.
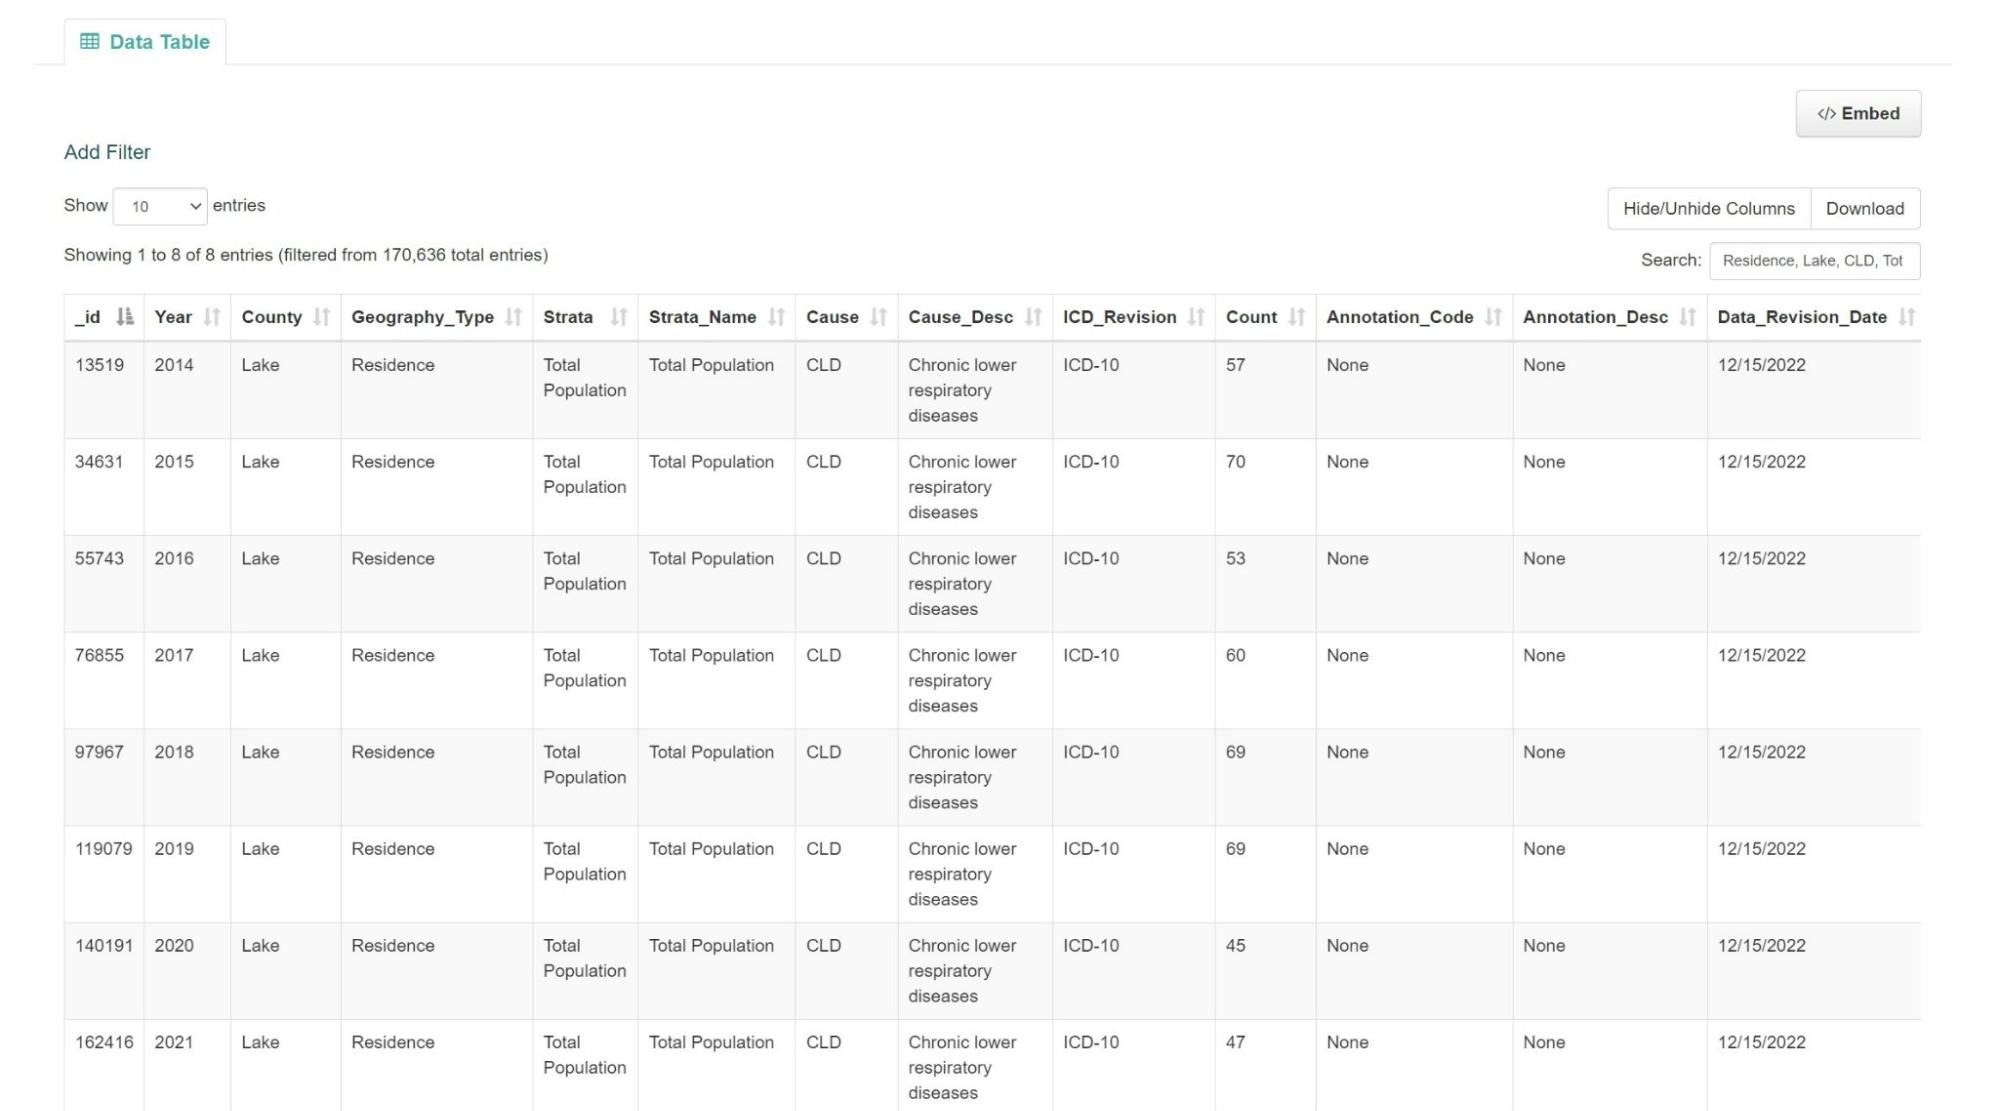
The California Health and Human Services’ website proved especially useful. We found easily sortable death statistics by county and for the entire state.
However, not all data is as conveniently accessible as what I found through CalHHS, as we found when sifting through census data and nation-wide mortality statistics through CDC Wonder. Learning the names and codes of the specific data sets we were looking for helped narrow down each search. For example, knowing to look for intercensal tables by 5-year age group was more helpful than digging through all possible census county tables.
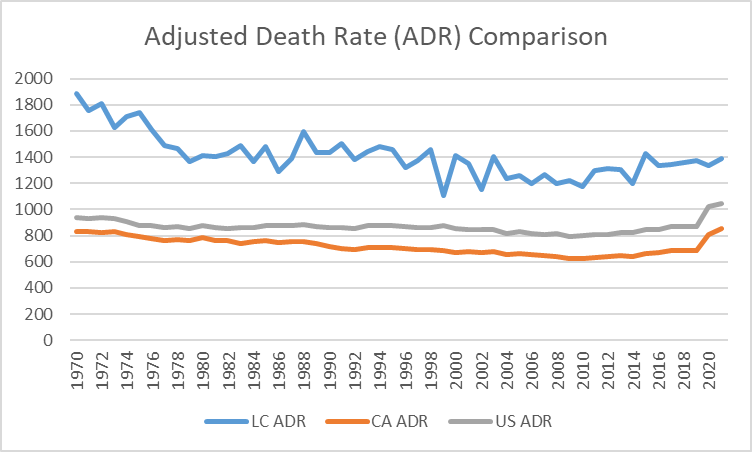
In order to fully understand health in Lake County, we also collected data for the entire state of California, the U.S. and Tehama County, California. This would help us compare Lake County to similar counties in California, the entire state and the country.
Here are the first few measurements we collected:
Total population: We found total population statistics for Lake County, Tehama County, California and the U.S. from the Census Bureau. Narrowing down which document contains what we needed was tricky, especially as the formats for displaying census population data changed over the decades. What we found most useful was searching for “county intercensal tables” with the decade we were looking for on the web. The census file database and Data Commons Place Explorer are other options for finding demographic data.
Total population 65 and over: When we thought about the possibility of increasing death rates, a top question was, “What if it could be related to a growing population of older people?” We found census files through the same database that categorized population by county and age.
Total deaths: We gathered data for total deaths overall, total deaths from chronic lower respiratory disease, total deaths from suicide, total deaths from cancer and total deaths from accidents. Looking through Lake County health reports and speaking with Larson helped me identify these four causes of death the county struggles with the most. We also calculated the adjusted rate per 100,000 people for each of these causes.
Calculating an adjusted rate per 100,000 people:
Crude numbers aren’t often the most helpful when comparing measures. For example, if there are 600 total deaths in a small county in one year, that number wouldn’t be helpful in comparison to a state with thousands of deaths, or a country with millions. Adjusted rates help to compare the same measures across different populations.
I calculated adjusted death rates with the following formula:
(Crude number of deaths/Total population)*100,000
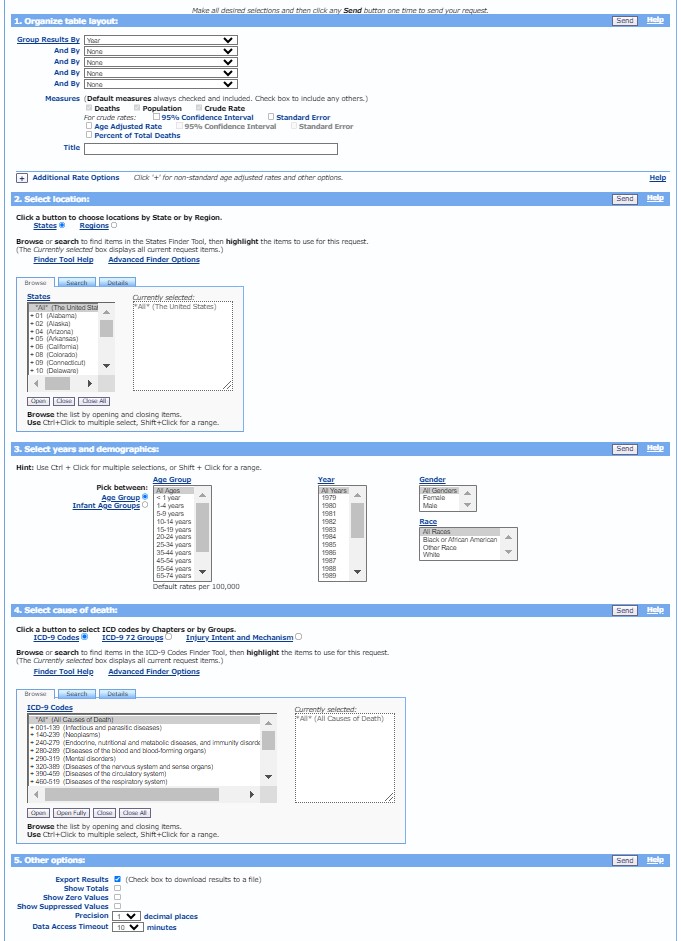
Although mortality statistics for California and its counties were readily available through CalHHS, finding national data was trickier. We looked into CDC statistics (available through CDC Wonder). It took a few test requests in the underlying causes of death database to narrow down what we needed and how to search for it.
Cleaning and organizing the data
For both population and mortality statistics, not everything we downloaded was in conveniently accessible Excel files formatted exactly how we needed (most were far from it).
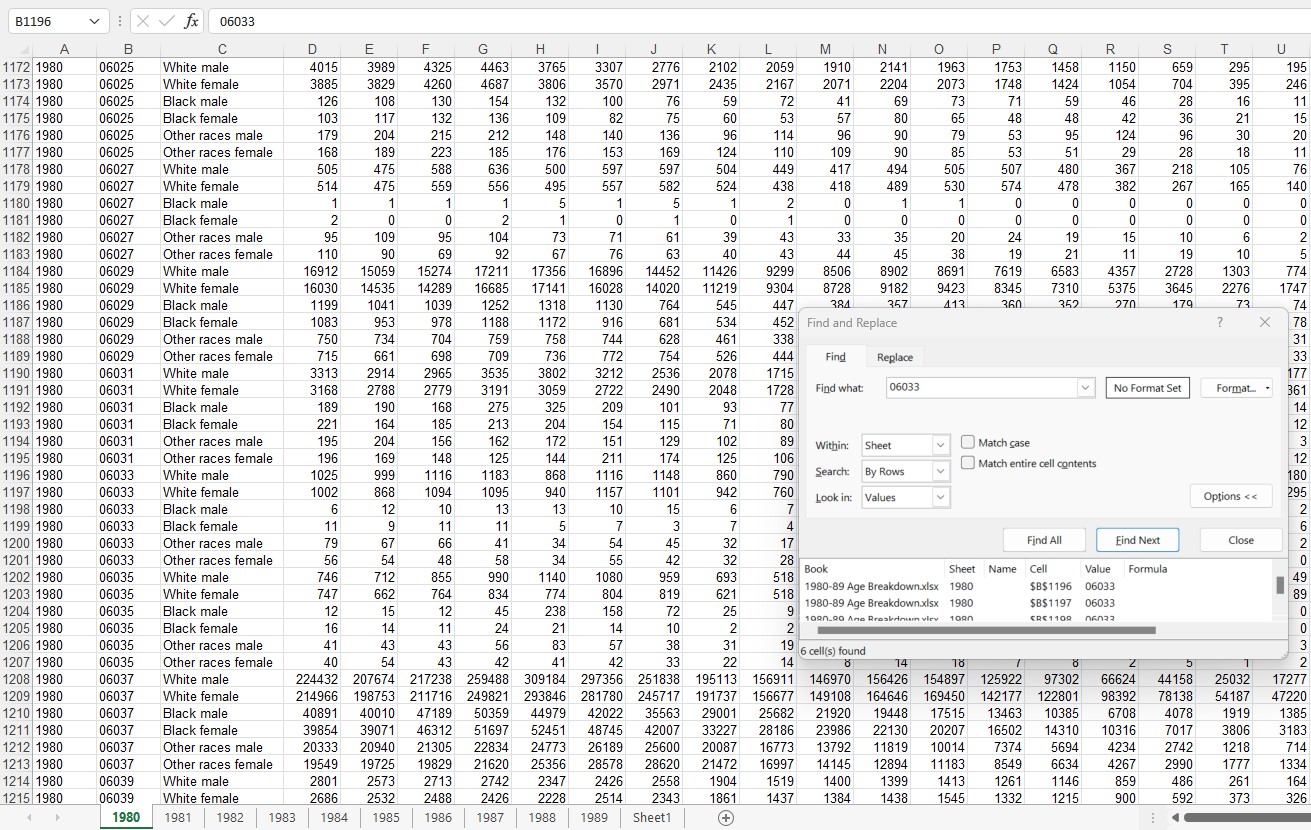
We could easily open the CSV and Excel files we got from the Census Bureau in Excel, but they were often cluttered with thousands of lines of data completely irrelevant to the project. For example, files that contain population data by county have data on every single county in the U.S.
Ctrl + F helped speed up the process greatly. For many of the files, we had to search by Lake County’s FIPS (Federal Information Processing System) code.
We copied the Lake County data for each year into another sheet within the file. We added a row between each year so we could calculate the totals for each age group. From there, we calculated the total population and the 65 and over population.
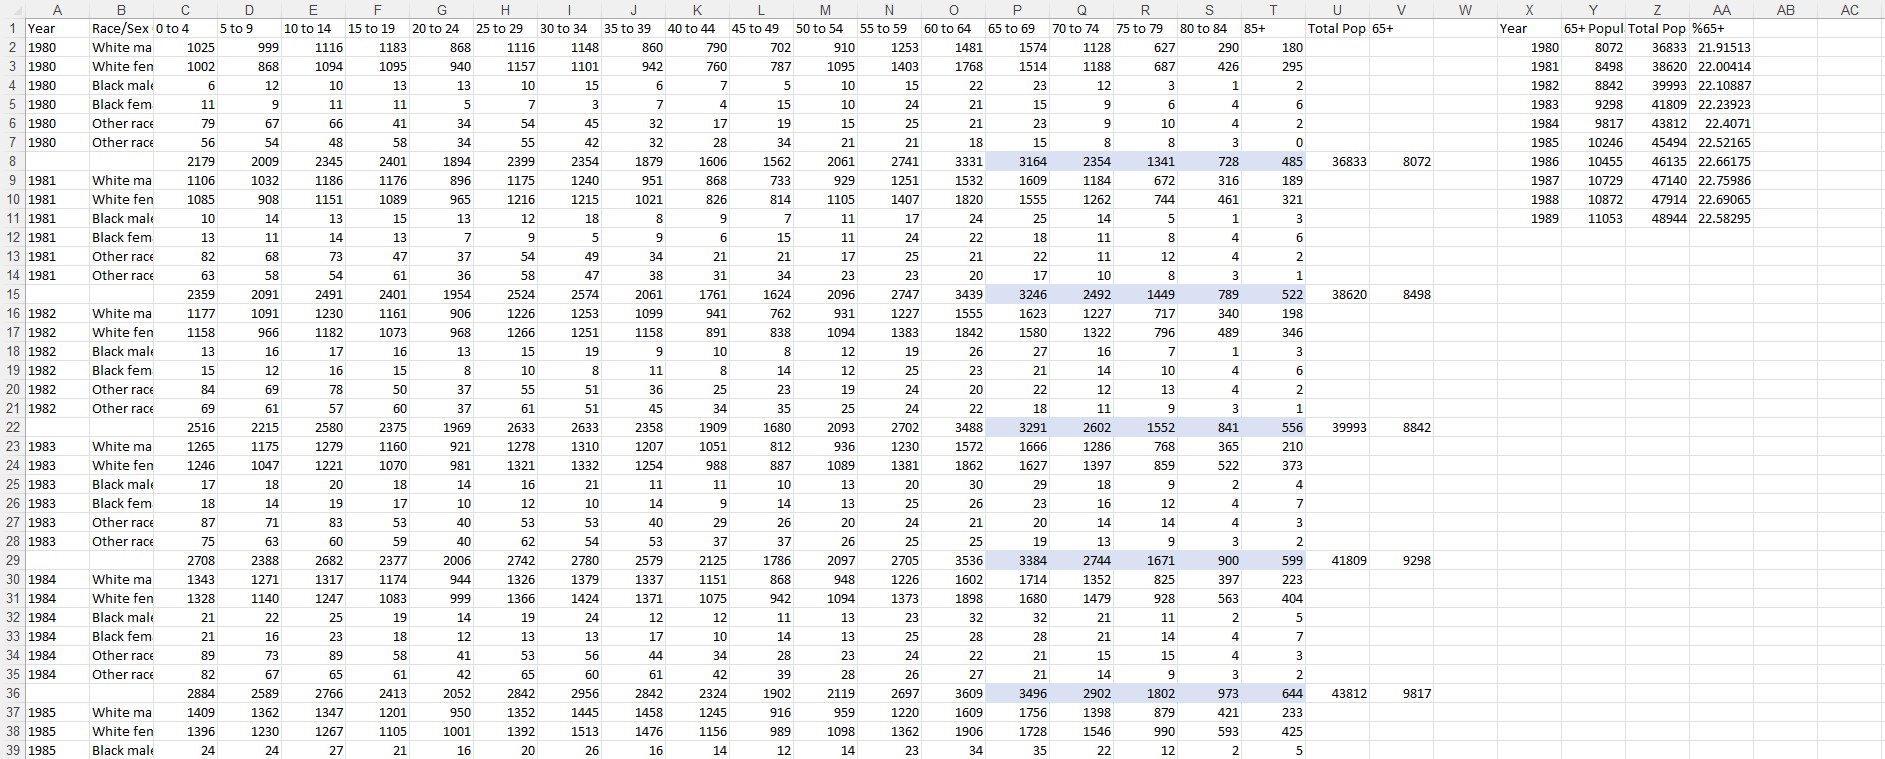
Once we got a succinct table together, we pasted it into the main spreadsheet that hosted data for both California counties, California and the U.S. We also kept basic line graphs within that spreadsheet that showed changes in measures over time.
Other data we encountered was only available through a text file. For some text files, we could easily copy and paste the data into an Excel spreadsheet with columns and rows intact. But if that’s not working, Excel allows users to open text files, as well.
Is mortality increasing in Lake County?
Short answer: yes. For about 35 years, mortality rates were following a general downward trend, but around 2010, the trend turned upward.
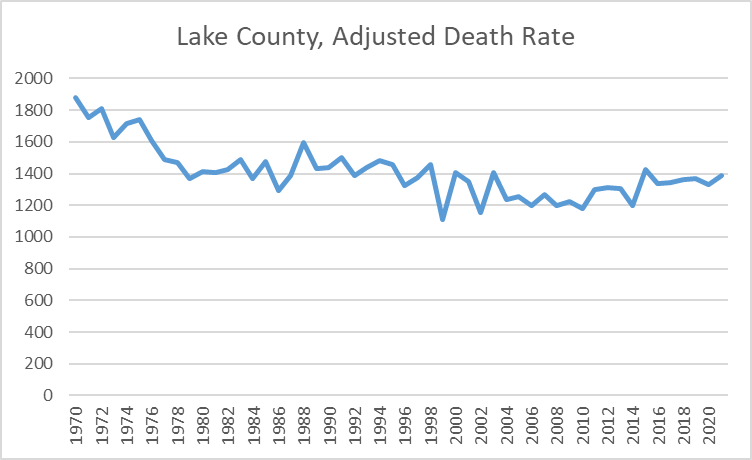
But is the increase significant? This is where pulling in all the contextual data has helped our newsroom. We learned that a growing aging population, premature death, poverty and other factors continue to contribute to these rising rates — in addition to the impacts of wildfires.
Acres burned in wildfires in Lake County have varied, sometimes drastically, like with the 2015 Valley Fire. The general trend, however, is upward. Although deaths from chronic lower respiratory disease have been generally following an upward trend, recent data shows a very slight downward pull.
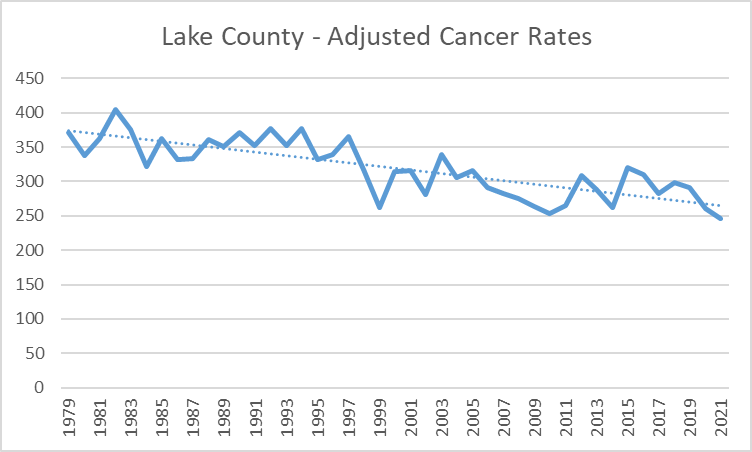
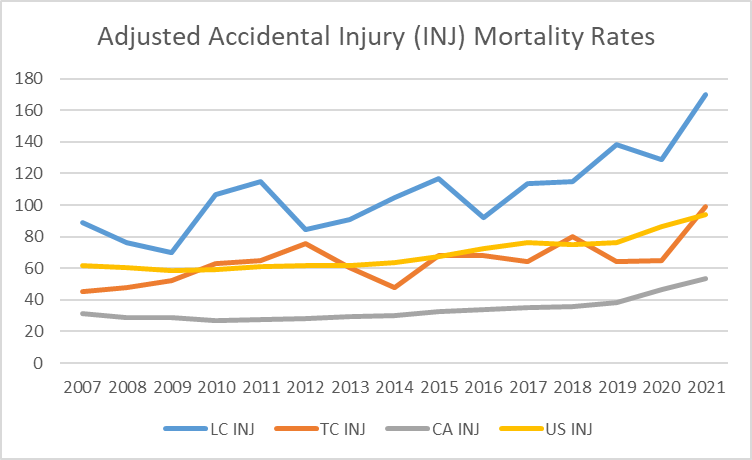
The adjusted death rate from cancer has also been following a downward trend. But Lake County is still well above Tehama County, California and the U.S. for injury death rates.
Final takeaways
Without more advanced statistical analysis, we cannot draw any definitive conclusions about why death rates are increasing. But armed with a library of data and observations, Lake County News now has a multitude of stories to pursue — from how the county can support its aging population, to increased access to health services to what measures can help mitigate negative health consequences from wildfires.
Ultimately, data collection can help journalists expand on previous reporting and build new stories and projects to assist their communities.

Sign up for the Innovation in Focus Newsletter to get our articles, tips, guides and more in your inbox each month!