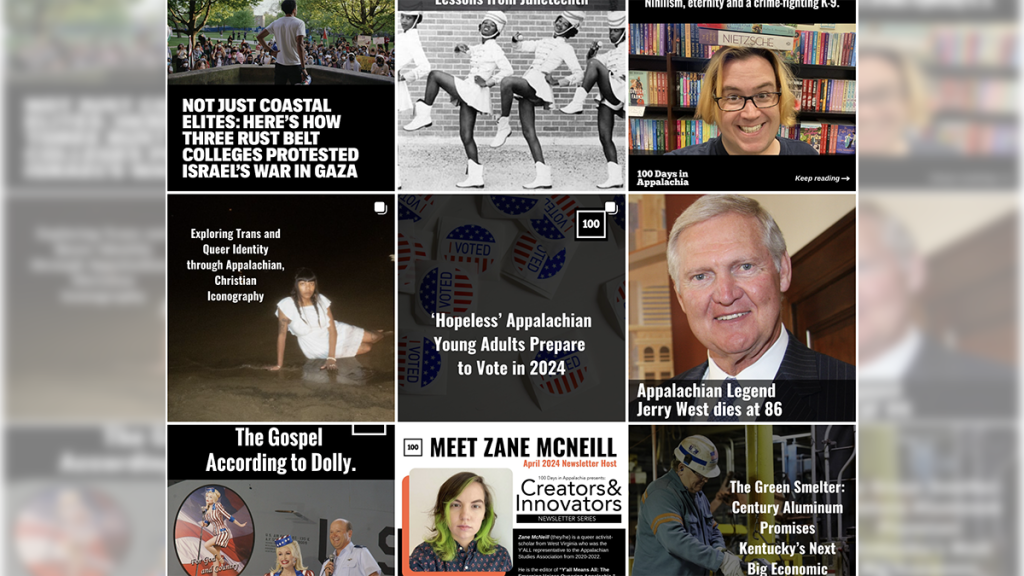
100 Days in Appalachia has been working to improve the consistency of posts and grow its audience on Instagram.
How we went from 800 to 7,000 accounts reached per month
Four tests 100 Days in Appalachia ran on Instagram to extend this newsroom’s reach
Colin Rhoads is a 2024 RJI Student Innovation Fellow partnered with 100 Days in Appalachia. The RJI Student Fellows will be sharing their innovative work throughout the summer in Innovation in Focus.
For the nonprofit newsroom 100 Days in Appalachia,, the primary goal is to grow engagement and awareness on social media. In order to do this, we needed to create consistency across our newsletter, website and social media content.
By creating a content calendar, we increased the consistency of our posts and tested different types to determine how we could reach the most people through Instagram. Ultimately, this dedicated effort led to our account reaching eight times as many accounts as it usually does.
From January to May 2024, 100 Days in Appalachia was getting anywhere from 700 – 1,100 accounts reached per month. From just June 4th to June 19th with the new strategy, we had over 8,000 accounts reached.
Creating a content calendar
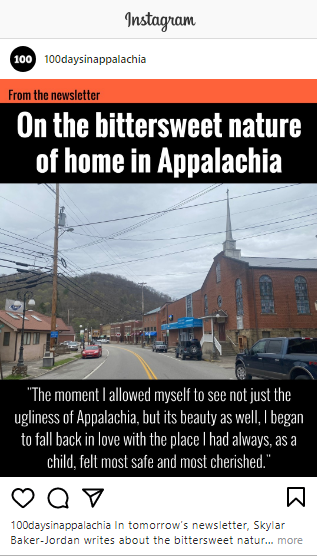
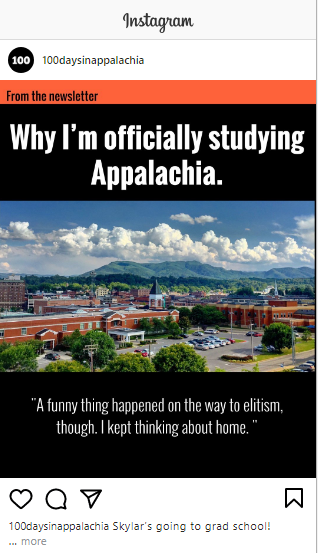
Since 100 Days in Appalachia has limited resources and staff, we decided to create a weekly content calendar so it would be easier to be consistent. The goal was to have a post and story every Tuesday, and a cultural analysis carousel post every Wednesday and Sunday.
Creating the calendar within Google Sheets made it easy to share with the team and keep notes of anything we saw on the surface level. We used Buffer to schedule everything based on the content calendar.

Within the content calendar, we wanted to see if:
- Posting more consistently would increase engagement (measured by post interactions like shares, comments, favorites, etc.)
- Carousels or static image posts performed better
- Consistently posting newsletter promos would increase our newsletter subscription rate
- Posting at different times/days would increase impressions of that post
For example, since we noticed that our first two carousels got over 1,700 impressions (higher than the usual 800-1,200), we decided to create a carousel for our newsletter promotions.
Why Instagram
It’s important to meet your audience where they’re at. Our newsletter audience is mostly female in the 25-44 age range or 65+ age range.

According to Hootsuite, 60% of Instagram users are 18-34. Therefore, Instagram lines up with our 25-44 age range.
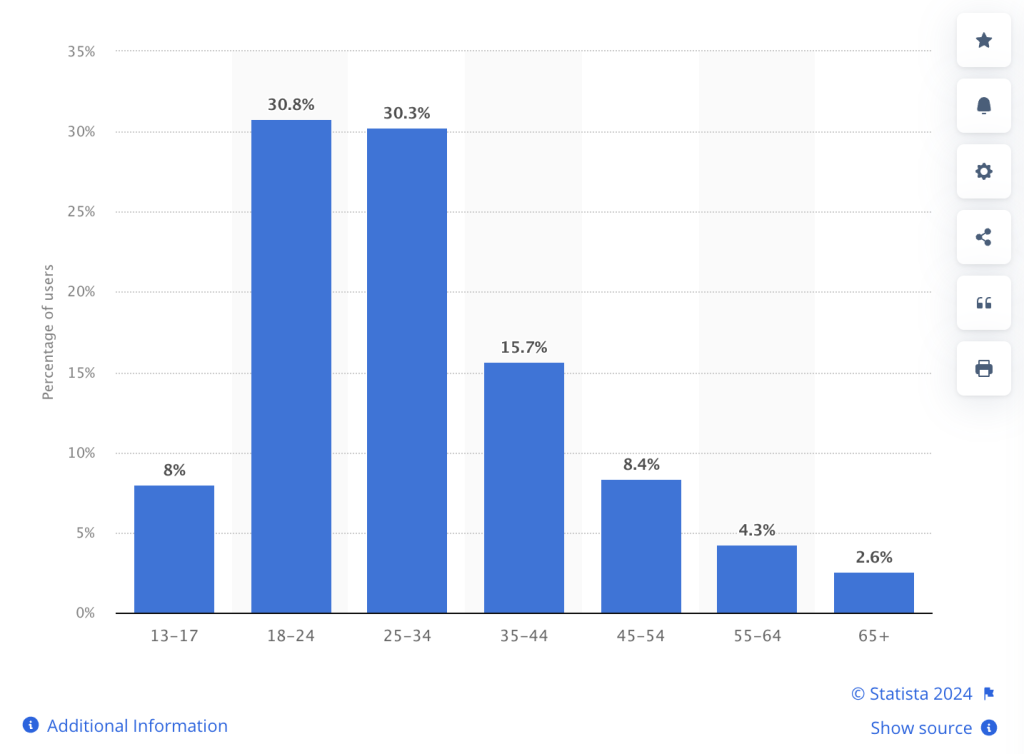
Since 100 Days in Appalachia always has a compelling visual with its news stories and recently did a photo-essay story, Instagram was the obvious choice. Even if Instagram isn’t our strongest current platform, it showed the most growth potential.
Deciding when and what to post
To decide what to post, we looked at what type of content our audience previously engaged with and what content they didn’t engage with.
Over the past two years, 14 of our 17 posts that got more than 2,000 impressions were promoting journalist Skylar Baker-Jordan’s weekly newsletter. Additionally, all 17 posts had some sort of Appalachian connection to them. Therefore, we decided to up the newsletter promotion quality by creating new templates and posting them every week on the day the newsletter goes out.
In 2024, we averaged 17 new newsletter subscribers a month. Since we started doing newsletter promotions (June 4), we’ve gained 14 new subscribers. While we may not see a huge shift in the subscription rate, we hope to better understand how our renewed promotions affect new subscribers growth after one month.
Designing visually appealing carousels
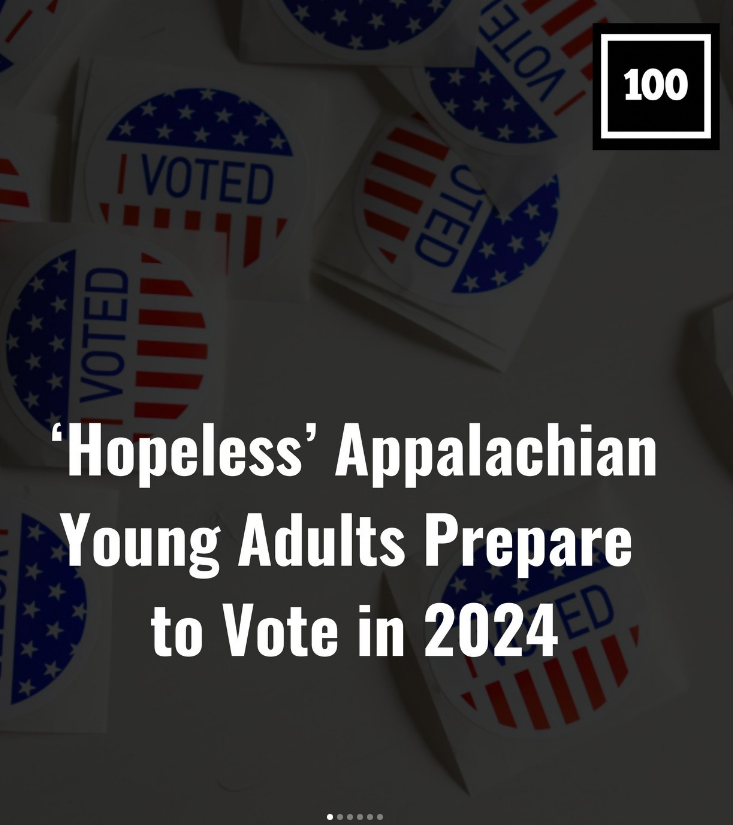
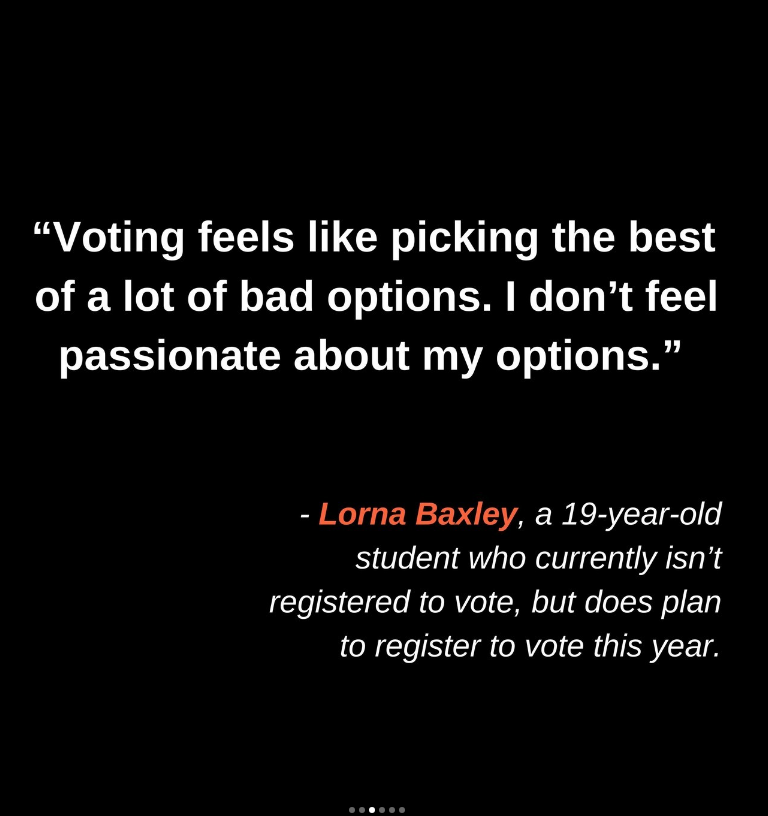
Knowing that well-performing Instagram news accounts use carousels and long captions to tell the majority of the story right on Instagram, we wanted to see if using a similar format would increase our engagement.
We also noticed that text-heavy posts generally did not perform well, so we aimed to create carousels with a balance of visual and text elements.
The above post, which uses compelling photography and a quote from the story, received 7,500 impressions and was our most visually appealing and best-performing post-all-time.
Our second carousel got 1,700 impressions, which was still well above our average.
See these posts and more on our Instagram at @100DaysInAppalachia.
The analytics
Since our tests’ start date on June 4th to now, June 24th, our metrics have increased or not changed as follows (compared to the previous three weeks.)
- Follower growth — 89, up 117%
- Accounts Reached — 7.8k, up 1,200%
- Link clicks on Facebook — 6, up 50%
- Content interactions on Instagram (likes, comments, shares) — 868, up 3,400%
- Newsletter subscriptions — 14, up 0%
We cross-referenced those metrics with when we posted and what we posted to find out when our audience is online and what content they connect with the most. For example, since our audience resonated most with carousels over Instagram stories, we are going to post more carousels as a part of our regular social strategy.

Sign up for the Innovation in Focus Newsletter to get our articles, tips, guides and more in your inbox each month!
Cite this article
Rhoads, Colin (2024, June 27). How we went from 800 to 7,000 accounts reached per month. Reynolds Journalism Institute. Retrieved from: https://rjionline.org/news/how-we-went-from-800-to-7000-accounts-reached-per-month/

