
1922 Journal of the American Medical Association publication from The William White library maintained by the Lighthouse Institute at Chestnut Health Systems. Photo: Graham MacIndoe
Reporting on treatment for addiction: Where is the data?

Improving care for people with addictions will continue to be a challenge — despite billions of dollars spent each year
Journalism tends to reward investigative reporting about wrongdoing, so it’s not surprising that coverage of treatment for addiction often highlights shady rehabs or problematic providers. In the U.S., there’s a centuries-long history of miracle “cures” and for-profit programs promising results they don’t necessarily deliver, as William L. White chronicles in his book, Slaying the Dragon: The History of Addiction Treatment and Recovery in America.
White is a historian, researcher, clinician, and person in recovery whose extensive archive — The William White Library — is maintained by the Lighthouse Institute at Chestnut Health Systems, which he co-founded in 1973. At the time, the goal was to move people with alcohol use disorder out of the criminal justice system and into community-based treatment.
Decades later, our understanding of what treatment in the community means or should accomplish is clouded by a lack of comprehensive data about the services currently offered. It’s also hindered by infighting among factions and pessimistic pronouncements that treatment “doesn’t work,” disagreements often inflamed by social media.
I’ve read several of White’s books and many of his interviews and papers, then visited his archive in Illinois in 2019 with my husband, Graham MacIndoe. Graham photographed some of the antique medicine bottles, brochures, books, advertisements, documents, and artifacts in the collection, which now has more than 200,000 items, including contributions from other individuals and institutions.

White’s work helped me understand the long history and evolution of addiction treatment and recovery — not just the opportunists selling bottled “cures” or the physicians prescribing heroin to treat cocaine addiction in the late 19th century, but also the dedicated counselors, social workers, peer support specialists, and mutual aid participants who work or volunteer their time in settings media coverage doesn’t fully capture.
To some degree, treatment and support for people with addictions happens behind closed doors, hidden from view. With billions of dollars spent annually on treatment for substance use disorders in the U.S., there’s a lot of opportunity for reporting on the services people receive, and whether this spending ultimately helps them achieve their goals.
What Is considered treatment?
One challenge for journalists covering care for people with substance use disorders is that there’s not a shared understanding of what “treatment” means.
Historically, discussions about types of treatment for substance use disorders focused on location or level of intensity, such as inpatient, outpatient, or residential. Lately there has been some effort to develop a consensus about what services, medications, and support should be offered by providers—in other words, what treatment someone receives, not just where it happens.
In 2025, the Substance Abuse and Mental Health Services Administration (SAMHSA) released National Guidance on Essential Specialty Substance Use Disorder Care—the first-ever federal guidance describing a list of services deemed essential for specialty substance use disorder treatment facilities in the U.S. These facilities typically serve people with more severe SUDs who have experienced significant health, legal, or social problems, as opposed to people with mild SUDs who may be more likely to seek help from a general therapist, primary care doctor, or other non-specialist provider.
Citing “a dramatic lack of consistency in services available to adults in need of specialty SUD treatment,” the guidance is intended to help identify treatment gaps, support evidence-based planning, and improve outcomes. It was developed with input from an expert panel, the National Association of Medicaid Directors, and the National Association of State Alcohol and Drug Agency Directors.
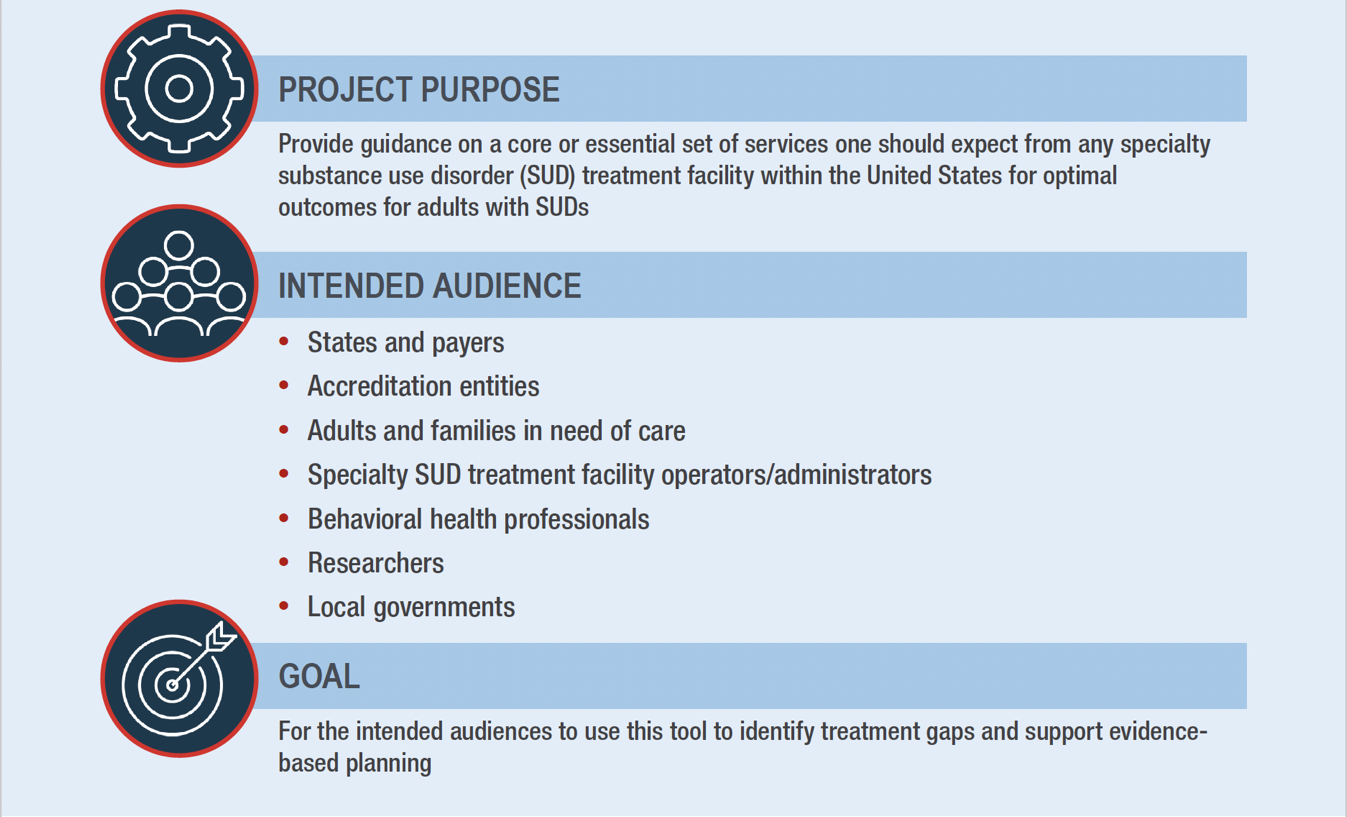
The services are presented in nine categories:
- Language access services: sign language and languages other than English.
- Assessment and pretreatment services: screening for substance use, tobacco use, and mental health disorders.
- Testing services: drug or alcohol screening; testing for HIV, hepatitis C, and sexually transmitted infections.
- Education and counseling services: marital and family counseling; HIV and hepatitis education and counseling; education about substance use, smoking, and health; individual and group counseling.
- Pharmacotherapies: medications for opioid use disorder, alcohol use disorder, and tobacco cessation; medications for mental disorders; medications for HIV and hepatitis C treatment.
- Medical services: detoxification/medical withdrawal, hepatitis A and B vaccinations.
- Recovery support services: assistance in locating housing and obtaining social services; employment counseling; vocational training or educational support; recovery coaching or peer support.
- Transitional services: discharge planning and aftercare/continuing care; naloxone and overdose education.
- Ancillary services: case management, social skills development, interpersonal violence services, transportation assistance, and mental health services.
Realistically, it’s unlikely that someone will find all the services they may benefit from in one place. But a shared understanding of what should be part of a treatment menu can help achieve meaningful person-centered care, selecting options tailored to individual needs and goals, which may change over time.
It would also help clarify ways to bridge harm reduction, treatment, and recovery, with services that cross over these categories, strengthening the continuum of care rather than fostering unhelpful divides.
Data about treatment facilities
The guidance on essential SUD care overlaps with SAMHSA’s National Substance Use and Mental Health Services Survey (N-SUMHSS), an annual survey of substance use disorder and mental health treatment facilities in the U.S. that has been published since 2021. Previously, similar information was collected by two separate surveys: the National Survey of Substance Abuse Treatment Services (N-SSATS) and the National Mental Health Services Survey (N-MHSS), which were combined to reduce the data burden on facilities.
N-SUMHSS collects information about types of treatment and services offered (including counseling, pharmacotherapies, testing, and ancillary services), whether the facility is public or private, special programs for specific client types, payment options, number of clients served, number of beds designated for treatment, and information about licensure, certification, or accreditation. This information is used for SAMHSA’s FindTreatment.gov site.
In addition to the 2024 N-SUMHSS report, which was published in 2025, annual detailed tables and a report featuring state profiles are also available.
The 2024 N-SUMHSS and detailed tables are based on data from 21,205 treatment facilities, including 15,953 substance use (SU) facilities, 14,091 mental health (MH) facilities, and 8,839 SU/MH facilities (which provide both types of care).
Highlights include:
- Client totals: 1,660,240 clients were reported to receive substance use disorder treatment on March 29, 2024. (The survey provides a point-in-time snapshot.) Among them, 837,070 were diagnosed with co-occurring mental and substance use disorders.
- Substances used: Most people were in treatment for substances other than alcohol (866,547) or both alcohol and other substances (527,071); 250,646 were in treatment only for use of alcohol.
- Adolescents: 96,691 clients under the age of 18 received care from substance use facilities with special programs or groups for adolescents; the vast majority (91,161 individuals) received outpatient care.
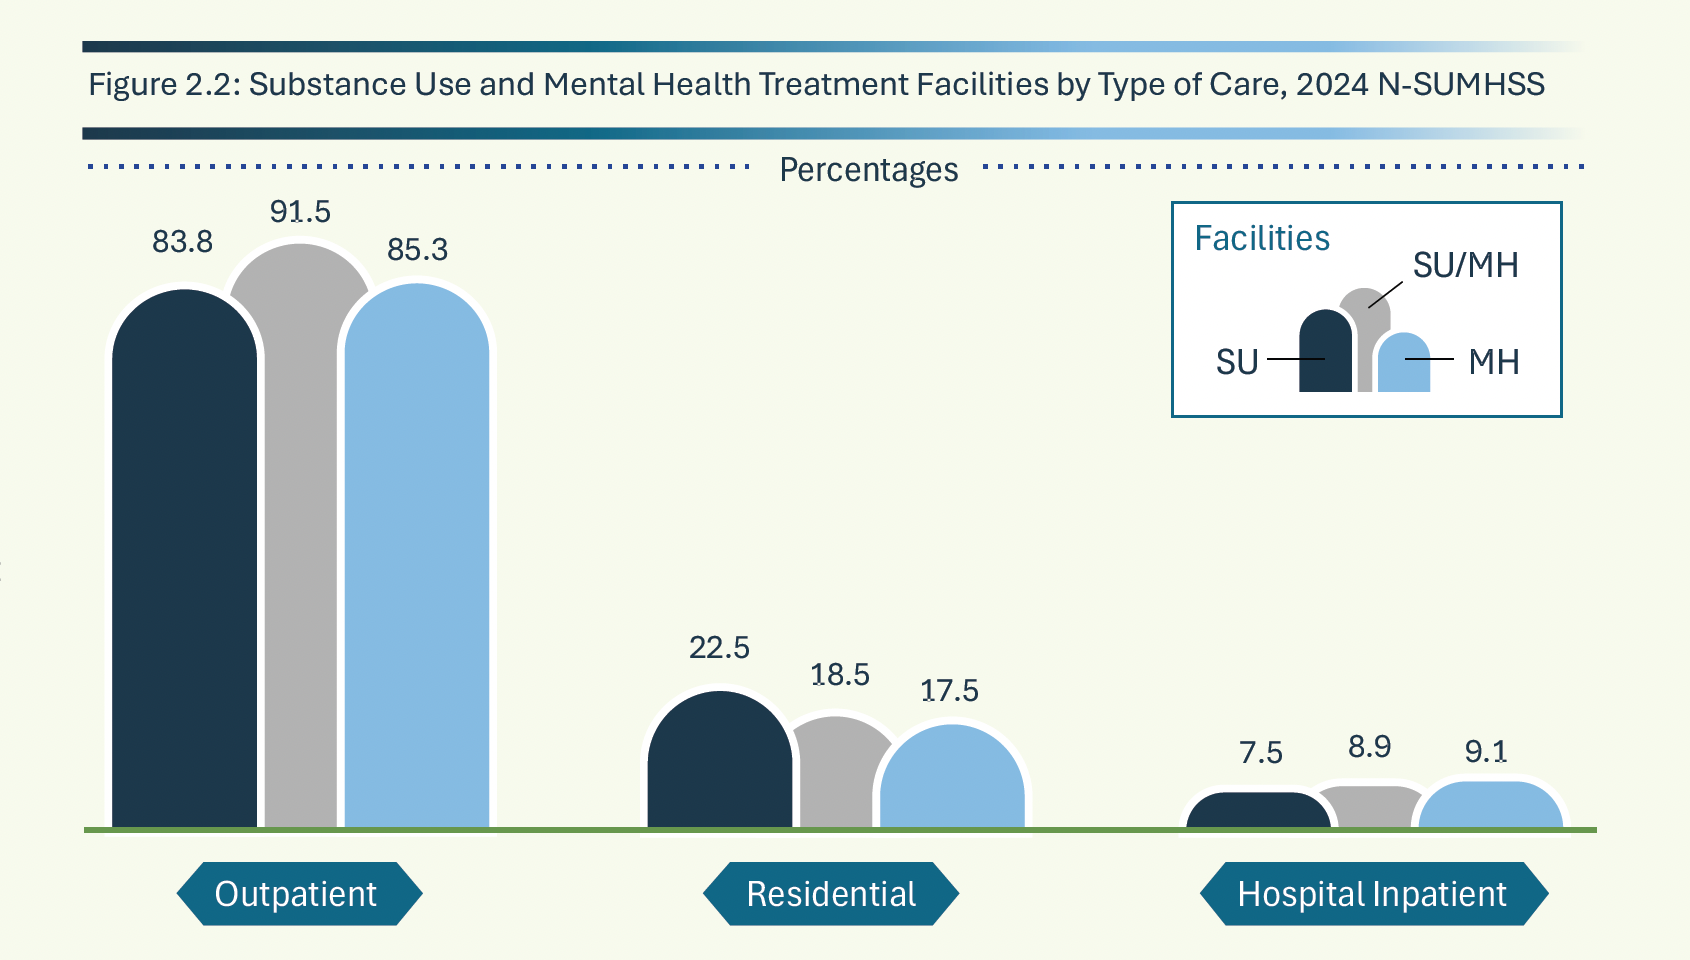
- Outpatient care was the most frequent type of service provided among SU treatment facilities (83.8%), MH treatment facilities (85.3%), and SU/MH treatment facilities (91.5%).
- Designated beds: SU facilities offering residential (non-hospital) care had 91,875 designated beds (DBs) and SU facilities offering inpatient hospital care had 24,499 beds for a total of 116,374 designated beds offering substance use care. Combined SU/MH facilities had a total of 47,768 designated beds, including residential and hospital/inpatient care.
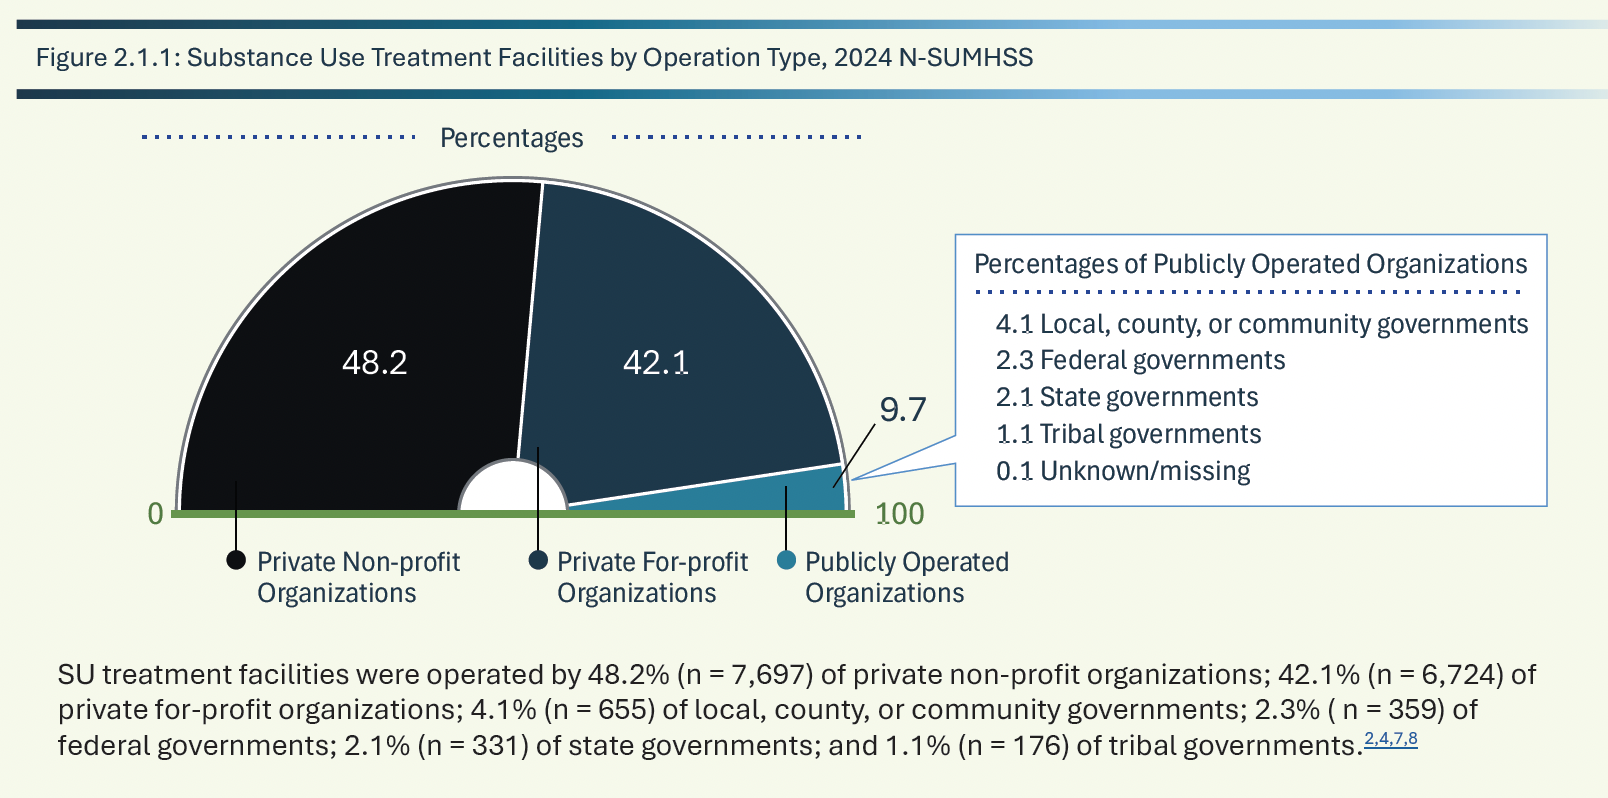
- Private non-profit organizations operated 48.2% of SU treatment facilities and private for-profit organizations operated 42.1% of SU facilities.
- Pharmacotherapies were offered by 76.5% of SU facilities as part of their treatment services. Among SU treatment facilities utilizing pharmacotherapies, 61.7% provided medications for opioid use disorder (MOUD), 49.9% provided medication for alcohol use disorder (MAUD), and 47.8% provided tobacco cessation pharmacotherapies.
- Education about overdose and naloxone was offered at 80.3% of SU treatment facilities.
- Payment was not accepted by 1.6% of SU facilities. Among SU treatment facilities accepting client payments or insurance, 89.9% accepted cash or self-payment, 78.3% accepted private insurance, 77.8% accepted Medicaid, 52.6 % accepted Medicare, 52.5% accepted state-financed health insurance plans other than Medicaid, and 46.9% accepted federal military insurance.
Data about treatment clients
Another report published by SAMHSA, the Treatment Episode Data Set (TEDS) collects episode-level data on clients aged 12 and older receiving substance use treatment services from facilities that are licensed or certified by single state agencies (SSAs). For each treatment episode, TEDS collects data on client demographics, substances used, the type and duration of treatment services received, years of education completed, and national outcome measures (NOMs). NOMs include stability in housing, employment status, criminal justice involvement, social support, retention in treatment, and abstinence.
The 2023 report, published in 2025, includes data that was received and processed by Dec. 2024. A file with detailed tables for the report is also available.
Highlights from 2023 admissions data include:
- Admissions: In 2023, there were 1,625,833 admissions to and 1,474,025 discharges from substance use treatment services as reported by SSAs. These figures do not represent individuals because people may have had multiple admissions.
- Age: The top two age categories were 21–34 years old (35.1%) and 35–44 years old (29.3%).
- Gender: 65.3% were male and 34.7% were female.
- Race: The top two race groups were White (64.4%) and Black or African American (20.0%).
- Ethnicity: 16.2% were of Hispanic or Latino origin.
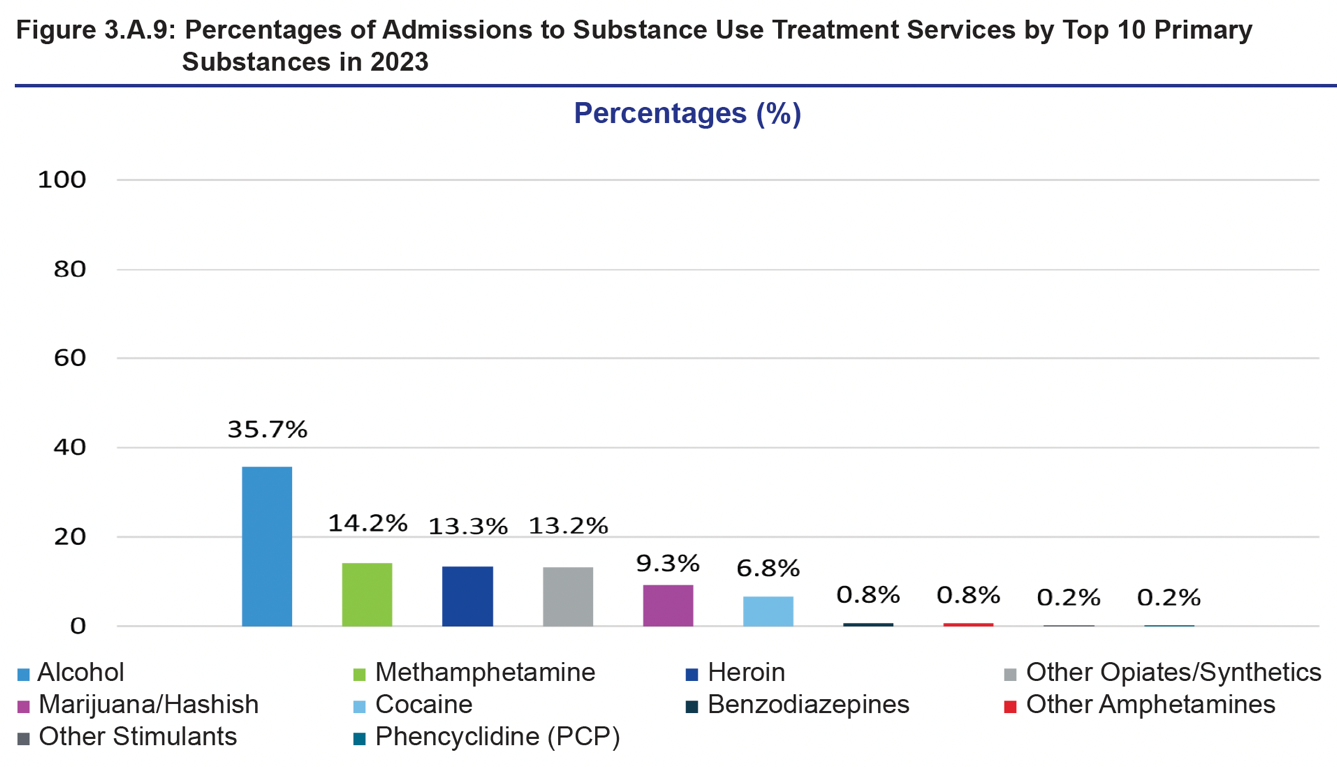
- Substances used: The top 10 primary substances used were alcohol (35.7%), methamphetamine (14.2%), heroin (13.3%), other opiates/synthetics (13.2%), marijuana/hashish (9.3%), cocaine (6.8%), benzodiazepines (0.8%), other amphetamines (0.8%), other stimulants (0.2%), and phencyclidine (PCP) (0.2%).
- Housing: The top two living arrangements were independent living (64.5%) and experiencing homelessness (19.1%).
- Employment: The top two employment statuses were unemployed (43.7%) and not in the labor force (30.4%).
Highlights from 2023 discharge data include:
- Discharge reason: Among discharges from substance use treatment services by reason, 42.6% completed treatment, 25.1% were transferred to further treatment, 22.0% dropped out, 4.8% were discharged for other reasons, 4.1% were terminated, 1.1% were incarcerated, and 0.3% died.
- Treatment length: The median length of stay at discharge for ambulatory–non-intensive outpatient services was 53 days, followed by ambulatory–intensive outpatient services (40 days), long-term residential/rehabilitation services (36 days), medication-assisted opioid therapy (MAOT) residential services (25 days), short-term rehabilitation/residential services (21 days), MAOT outpatient services (10 days), hospital rehabilitation/residential services (7 days), MAOT detoxification services (6 days), free-standing residential detoxification services (5 days), hospital inpatient detoxification services (4 days), and ambulatory — detoxification services (3 days).
- Substance use at discharge: Among discharges from substance use treatment services, 30.1% were abstinent, 50.6% reported substance use, 19.0% were missing data, and 0.3% were excluded due to death.
What national treatment surveys don’t track
The main thing national treatment surveys don’t track are meaningful client outcomes, like whether someone still meets any of the 11 criteria used to diagnose a substance use disorder when they complete, drop out, or are discharged from treatment.
That’s in part because treatment is typically short — less than two months, and sometimes just a few weeks — which is not nearly enough time for people with severe substance use disorders and complex needs.
As William White said in an interview in 2014,
“Modern addiction treatment emerged as an acute care model of intervention focused on biopsychosocial stabilization. This model can work quite well for people with low to moderate addiction severity and substantial recovery capital, but it is horribly ill-suited for those entering treatment with high problem severity, chronicity, and complexity and low recovery capital.
With the majority of people currently entering specialized addiction treatment with the latter profile, the acute care model’s weaknesses are revealed through data reporting limited treatment attraction and access, weak engagement, narrow service menus, ever-briefer service durations, weak linkages to indigenous recovery support services, the marked absence of sustained post-treatment recovery checkups, and the resulting high rates of post-treatment addiction recurrence and treatment readmission.
Addiction treatment was developed in part to stop the revolving doors of hospital emergency rooms, jails and prisons. For far too many, it has become its own revolving door.”
More than a decade later, this assessment is still accurate in many ways.
For reporters covering treatment for addiction, it’s important to understand and explain this context when evaluating outcomes for different services.
Someone could get the best treatment in the world for a few weeks, but if their housing situation is precarious, they’re unemployed, they have untreated mental health or medical conditions, and they have minimal support for recovery, our system of care isn’t set up for them to succeed.
To sign up for email alerts when these monthly articles are published or offer feedback about the Covering Drugs toolkit I’m developing, you can fill out this form or click the link below. I’m especially interested in finding out what questions or topics journalists would like to see included, including challenges reporters have encountered finding information or data. I also welcome suggestions from researchers, service providers, policymakers, advocates, and people personally impacted by substance use and addiction.
Cite this article
Stellin, Susan (2026, Jan. 8). Reporting on treatment for addiction: Where is the data?. Reynolds Journalism Institute. Retrieved from: https://rjionline.org/news/reporting-on-treatment-for-addiction-where-is-the-data/