Systems Mapping for Storytelling: Tips for using Kumu
Rachel Thomas, former University of Missouri student, tested Kumu, a systems mapping tool, for highlighting relationships and connections for storytelling for this month’s Innovation and Focus. Kumu is a browser-based, public and free tool.
Here are her top five tips from her experience utilizing Kumu for the brewery piece:
1.) Do some reasearch so you understand systems mapping
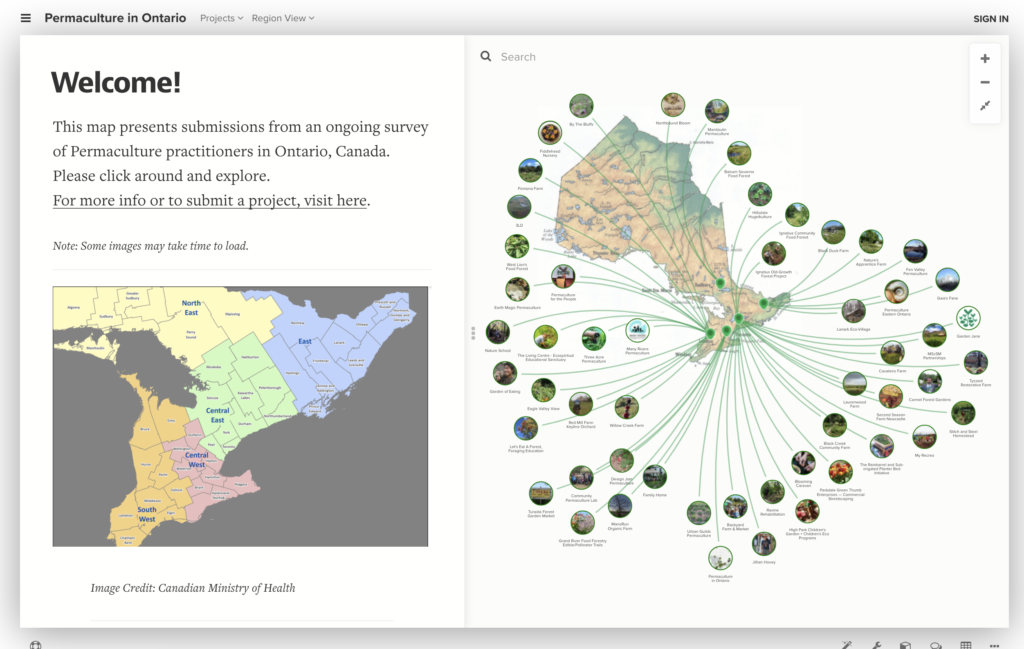
Systems mapping is a way of visualizing the underlying structure of a system in order to better understand why and how it operates. An interactive systems map can be an engaging way to tell a story explaining connections or the multitudes of a systematic problem. Systems maps have two main components: elements and their connections. If you are trying to explain a linear process through your storytelling, like a chronological timeline, a flat infographic or slideshow may be a cleaner format than a systems map. To gain quick insight into systems mapping I recommend finding examples through Kumu’s website and Medium such as “Tools for Systems Thinkers: Systems Mapping” by Leyla Acaroglu.
2.) Determine if your story has the elements and connections to be a systems map
A quick way to determine if your story could be a potential systems map project is to physically draw the elements and how they connect to the question, topic or problem your story addresses. Draw how they connect to the core issue and how they connect with each other. After spending some time drawing out the connections, you can then determine if a systems map would be more engaging than another storytelling format such as an article or explainer video. The more elements and connections there are makes for a robust systems map.
3.) Determine the types of connections and/or relationships
Connections and relationships are the bread and butter of creating an interactive systems map. Users will not only be able to click on each element to learn about them individually, but will be able to see the connections between elements. This leaves you the opportunity to explain connections in more depth between people or companies. For example. Kumu has three primary map templates you can use depending on the connections that make up your story: system, stakeholder or SNA. If you’re explaining the structure and connections of a system choose the system template. Utilize the stakeholder template if you want to visualize connections between people or entities that are involved or connected to the story. And lastly, if you have a large amount of data you can use SNA to better understand the elements with the most influence or to discover money trails. If your story falls in none or more than one of these categories, then you can use the custom template to create your own.
4.) Determine how much autonomy the reader will have
Within Kumu you can create a systems map either alloting the user full autonomy over their journey or placing constraints on what a user can explore. Think about how you would like the user to explore the story. If there is an ideal starting point and major consecutive elements along the way, Kumu enables you to add one or more systems map to a presentation. Or perhaps you want to incorporate other multimedia elements into the piece in addition to the map(s). The slideshow tool lets you start the story with a short text-only article to brief the reader or perhaps a video. Then you choose what the user will see every for each slide and in what order. If you’d like the user to have full autonomy over their experience, then provide access to the entire map or maps you created for the story.
5.) Create systems maps to better understand missing pieces
Even if you do not end up utilizing an interactive systems map as the format to tell your story, visualizing the system, problem or topic that your story is tackling can be an incredibly helpful exercise to piece together the story and find the missing pieces. It’s also a great way to help you and your collaborators better understand the issue at hand in order to explain it well in other formats. You can keep track of the information gathered and their connections all in one visualization. With Kumu you can add others in your newsrooms as collaborators, similar to how multiple writers can access and edit one Google Doc or how developers can collectively edit and create new branches of code in GitHub. This gives a team the abillity to work together to create an interactive presentation.