
One-on-one meeting with Milwaukee Journal Sentinel’s project manager to get feedback on using the Source Matters tool.
Testing API’s source tracking tool with local newsrooms

Lessons learned and common challenges with implementing the Source Matters tool
Han Vu is a 2023 RJI Student Innovation Fellow partnered with American Press Institute in Arlington, Virginia. The RJI Student Fellows will be sharing their innovative work through Innovation in Focus.
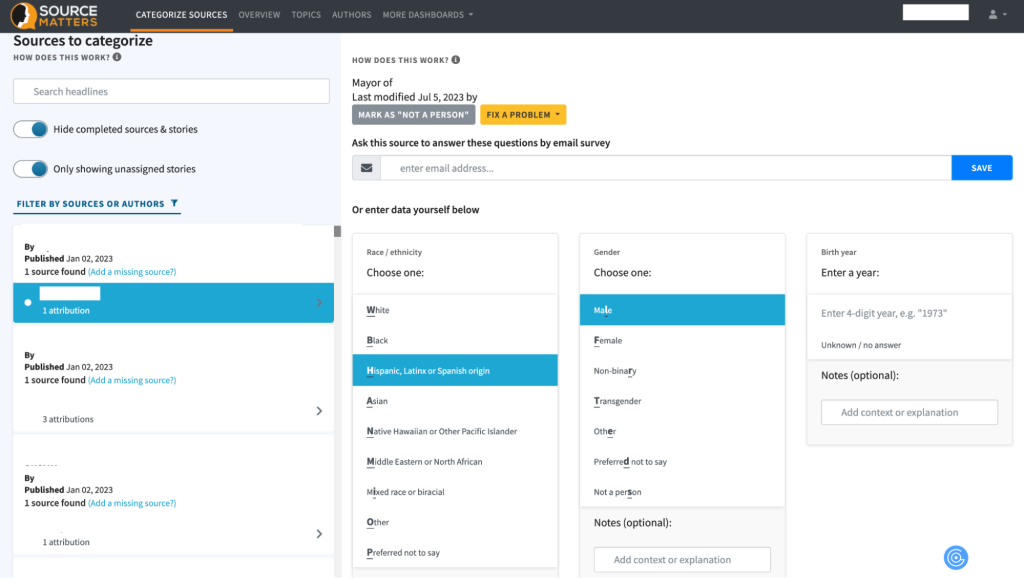
API developed the tool Source Matters and launched it in 2021 to help lighten the load for reporters looking to track their sources. By utilizing natural language processing (NLP) algorithms, the tool examines each story after it is published, automatically detecting and extracting all the names of individuals who have been quoted or attributed. It pulls the names out for the journalist and then allows the journalist to log the source’s demographic information, after asking how the source identifies across a few different identity categories.
This year, we are working with a cohort of 12 local newsrooms that gained access to the tool for free, with the commitment to make their source data publicly available for transparency and accountability. We are also collecting feedback from these newsrooms to continue to improve the user experience of Source Matters.
What we have learned from newsrooms testing the tool so far
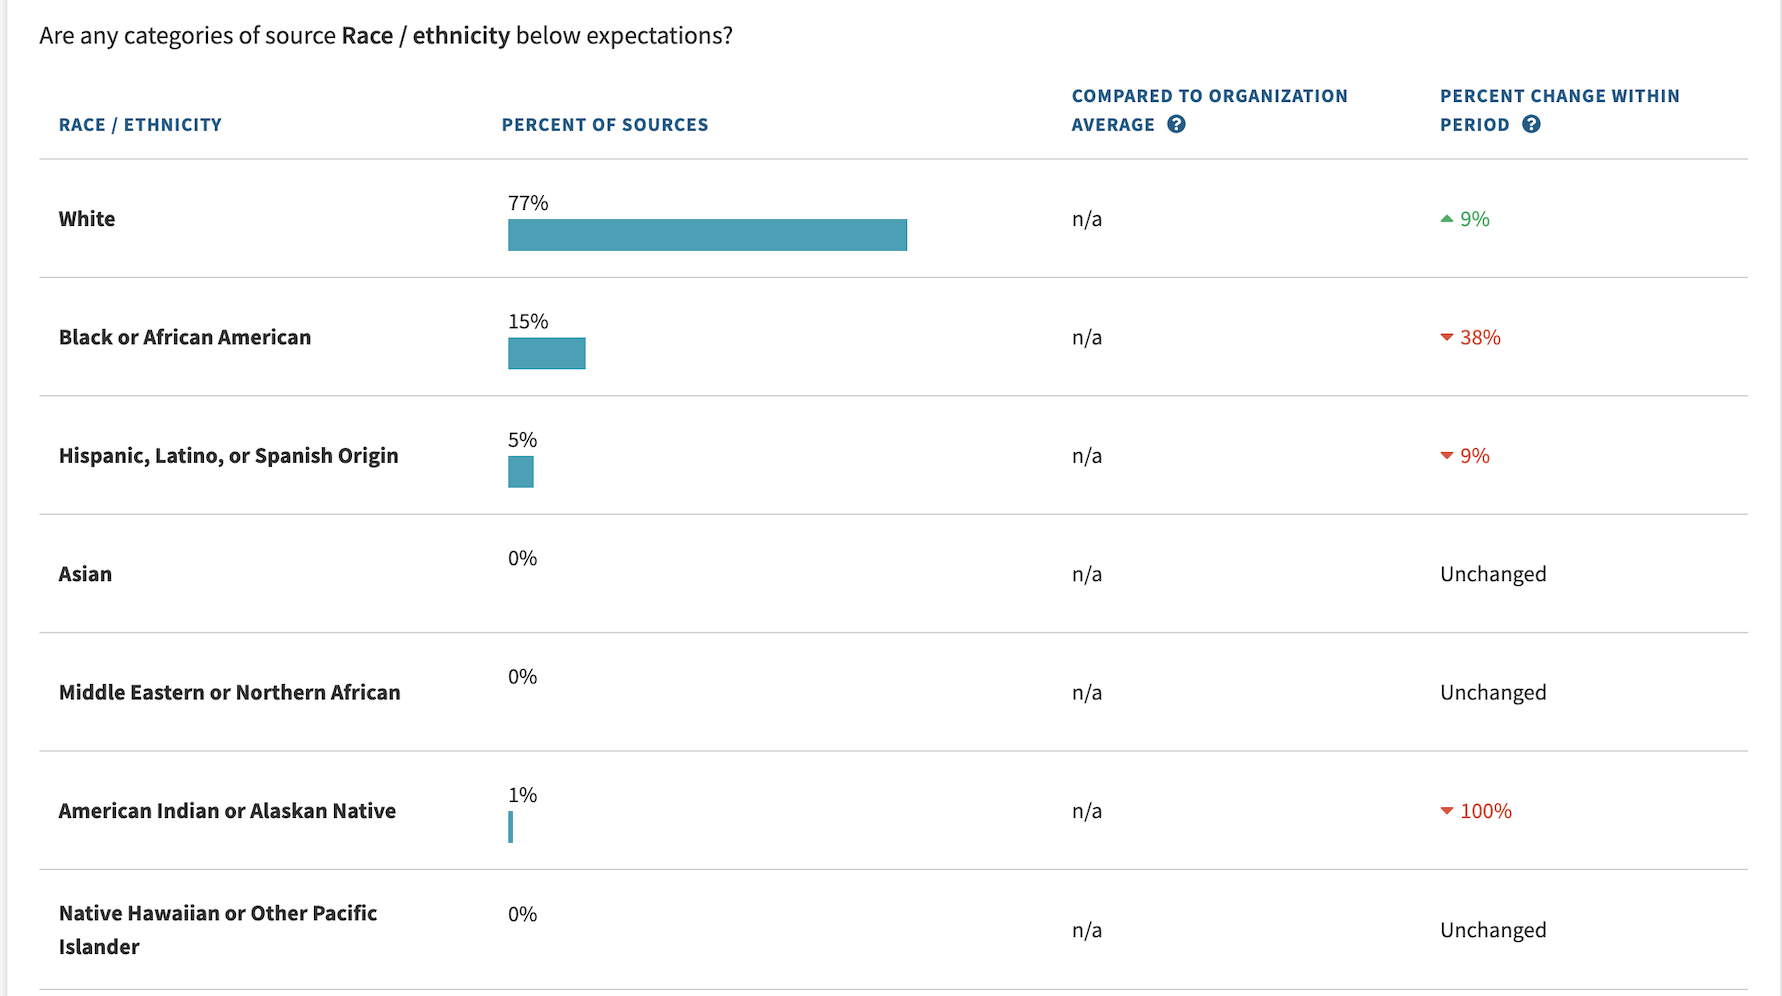
The data collected from these newsrooms using the tool during testing periods yielded unsurprising results. It revealed that in most cases, conversations were predominantly dominated by white males between the ages of 35 and 54 who held official positions. However, each newsroom interpreted and reacted to the data differently.
One news organization based in Vermont conducted a targeted two-week data collection period, which highlighted a gap in their inclusion of sources from lower socio-economic backgrounds. Another smaller organization in San Antonio, Texas, conducted a month-long collection period and discovered that certain city council districts were underrepresented in their coverage. Other organizations are using the tool more broadly to examine how they reach specific demographics based on age, gender, or race/ethnicity.
This effort was not intended to impose strict guidelines or obligations on journalists. Instead, it served as a method for journalists to evaluate their work critically. It can be a proactive step towards dismantling long-standing inequalities in representation and amplifying the voices of marginalized individuals.
Each newsroom had its unique objectives and priorities regarding source tracking. Therefore, our current responsibility is to assist these newsrooms in using the tool effectively and meaningfully.

Addressing common challenges with the API source tracking tool
Aside from technical difficulties and occasional confusion regarding data interpretation, some newsrooms also encounter resistance from staff. Newsrooms in the cohort are no different, experiencing low participation rates from their reporters. Source tracking can be time-consuming, especially in resource-strapped newsrooms facing tight deadlines and a high volume of news stories. Journalists are expected to allocate extra time to accurately identify, verify, and record sources.
To address these challenges, the API product team focused on gathering feedback from partners through regular communication channels such as monthly group meetings, one-on-one meetings, emails, and surveys to learn how to take more work off reporters’ shoulders. By actively engaging with newsrooms, learning from their experiences, and incorporating feedback, the team aimed to continuously improve the tool’s effectiveness. This process also facilitates the sharing of best practices among the participating organizations.
Here are tips we have heard from newsroom leaders to encourage reporter participation
- Mention source tracking frequently in staff meetings for reporters to be mindful of it.
- Frame the organization’s performance in terms of whose voices are getting quoted this week or month.
- Provide top-down messages to help reporters understand the organization’s commitment to source diversification and representation.
- Give reporters access to the dashboard and make their own interpretations about their data and decide how to use it.
- Create an easier process for reporters to ask for their sources’ information, such as sending a quick survey by email after the interview, sharing a QR code on their business cards, or pulling up the survey on their phone to ask sources to fill out if they have one minute.
- Assign someone to handle source tagging based on the survey outcomes, if possible, to relieve reporters of that task.
- Allocate dedicated time for reporters to sit down (with free coffee and snack, if possible), do the source tagging and discuss it. Journalists love free pizza!
The API team not only assists newsroom partners in incorporating more data into their decision-making processes but also aims to demonstrate that local newsrooms with limited resources and no dedicated data personnel can still effectively leverage data for source tracking and gain insights into community demographics, interests, and needs. Additionally, we seek to help newsrooms understand their communities better by utilizing visual aspects and data from the Census Bureau, recognizing that not all newsrooms have access to data experts.
In the next phase of this work, we plan to develop an interactive community map that visually shows local community demographics and socioeconomic status. This tool will serve as a point of reference for newsrooms, providing contextual information and guiding their reporting. The map will be regularly updated so that newsrooms can easily access the latest data and gain a comprehensive understanding of their community. While this software can only do so much, our team believes that this service component is where they can truly add value for newsrooms.

Sign up for the Innovation in Focus Newsletter to get our articles, tips, guides and more in your inbox each month!