
Photo: Lucas van Oort, Unsplash | https://unsplash.com/@switch_dtp_fotografie
Scrappy hacks for scrappy visual journalists

As far as I can tell, the Internet is mostly duct-taped together. And why should visual journalism be any different? In a world of flashy D3.js wrappers and React components and the like, sometimes you just need a chart—and you need it as quickly as possible. In other words, you don’t need interactivity; you need something that’s the right size, the right resolution, and allows you to use your publication’s custom fonts and colors. Bonus points if you don’t have to write a line of code.
I’d like to make a pitch for the unglamorous. Faced with, say, an HTML table, how can you go from data to publication-ready graphic as quickly as possible?
Templating
First things first. To set yourself up for success, you’ll need some template files: the kind of stuff you’ll only ever create once but return to again and again. Data visualization is at its slowest when you have to slog through reminding yourself where your publication’s logo is on the server and how to place it on your graphic with matplotlib or a similar charting library. Let’s skip all that.
Instead, for each non-programmatic design tool in your visualization pipeline, consider creating a template file to leverage as a future starting point. Take Tableau, for instance. The data-visualization platform makes spinning up simple charts as straightforward as dragging and dropping. But you don’t want to reset your fonts and color palettes and output size every time you open a workbook.
Solution: Only do it once. In the case of Tableau, start with a blank workbook and dashboard, and via the Format → Workbook menu, set some default preferences that match your publication’s house style. Maybe you place your publication’s logo in one corner; maybe you insert a text box for a data-source citation. The point is: All that should be missing is the visualization in question.
Whatever your mock-up tool of choice—maybe it’s Excel; maybe it’s Tableau; maybe it’s Illustrator—the real coup here will be to ensure you save your template file as read-only. That way, if you ever forget you’re working with the template, you won’t accidentally save over the initial version.
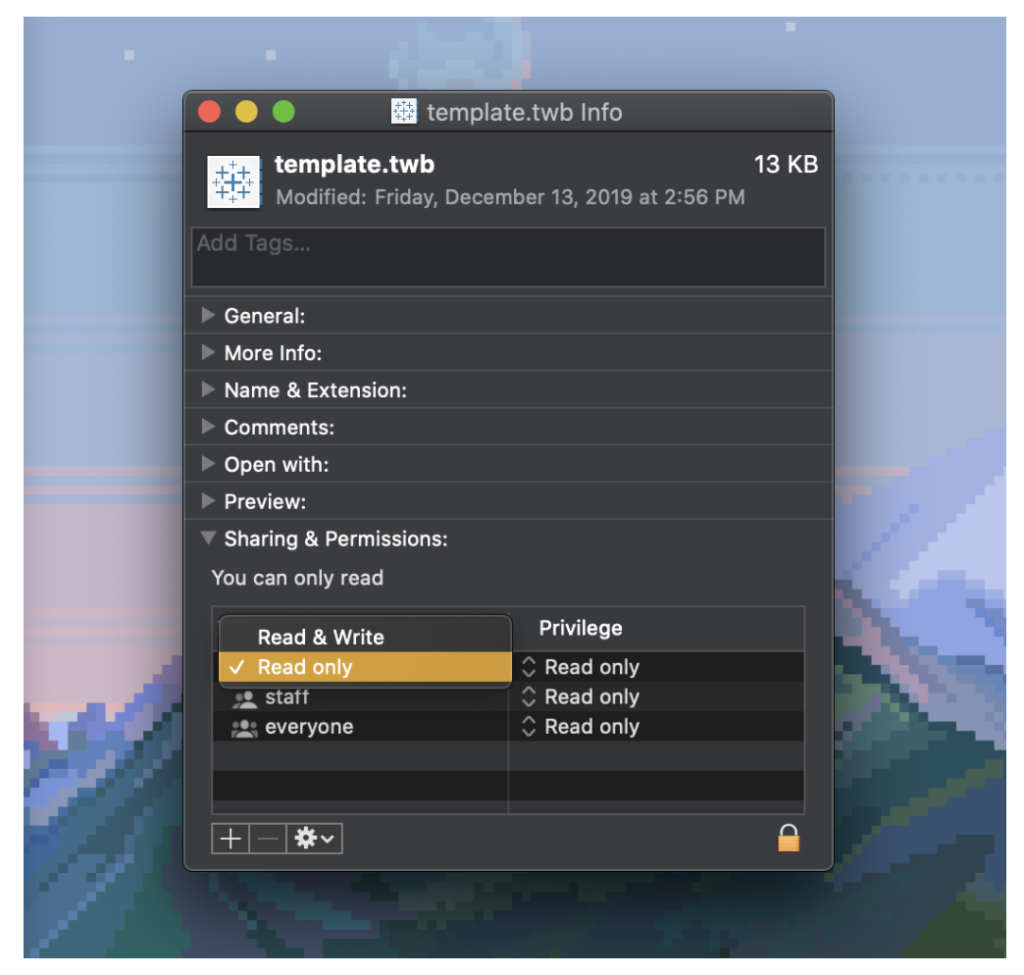
To convert a file to read-only mode, save the template as you would any other file, find the file in your file manager, and change the permissions to “read only” for all users. If you’re working on a Mac, you’ll find the appropriate settings after clicking “Get Info” for the file in question:
The next time you open that file, make changes, and attempt to save, you’ll be prompted to rename the file as a new version—and your template will remain untouched.
Copypaste
With some templates in hand, it’s off to the races. The central point of this post is that your computer’s copy-paste functionality is more powerful than you might expect.
Starting with that ugly HTML table in front of you, highlight all the cells and hit cmd+C. Depending on where you’re planning on working, a surprising majority of analysis engines retain the tabular structure of the data on your clipboard. If you select a cell in your shiny new Excel template and paste, your table will appear as such. A Tableau template, too, will handle a healthy cmd+V: The software will treat your clipboard as a data connection and parse it accordingly.
Whatever program you’re working in, inevitably there’ll be some finishing to do. That’s where your Illustrator or Inkscape template will come into play. The small miracle here: Copying a visualization or dashboard from most standalone data-visualization engines will copy the underlying vector graphic. That is, sticking with our example, if you’re working in Tableau and select Dashboard → Copy Image, now you’ve got a vector version of your graphic on the clipboard. Paste it into your Illustrator template, add any necessary finishing, export your chart, and Slack it to your pal.
With this scrappy pipeline, I can go from HTML table to publication-ready PNG in under three minutes. Try it and let me know if it works for you!
Have any more visual-journalism hacks to share? You can get in touch with Clayton Aldern at caldern@grist.org on Twitter @compatibilism.