Tag: Canva
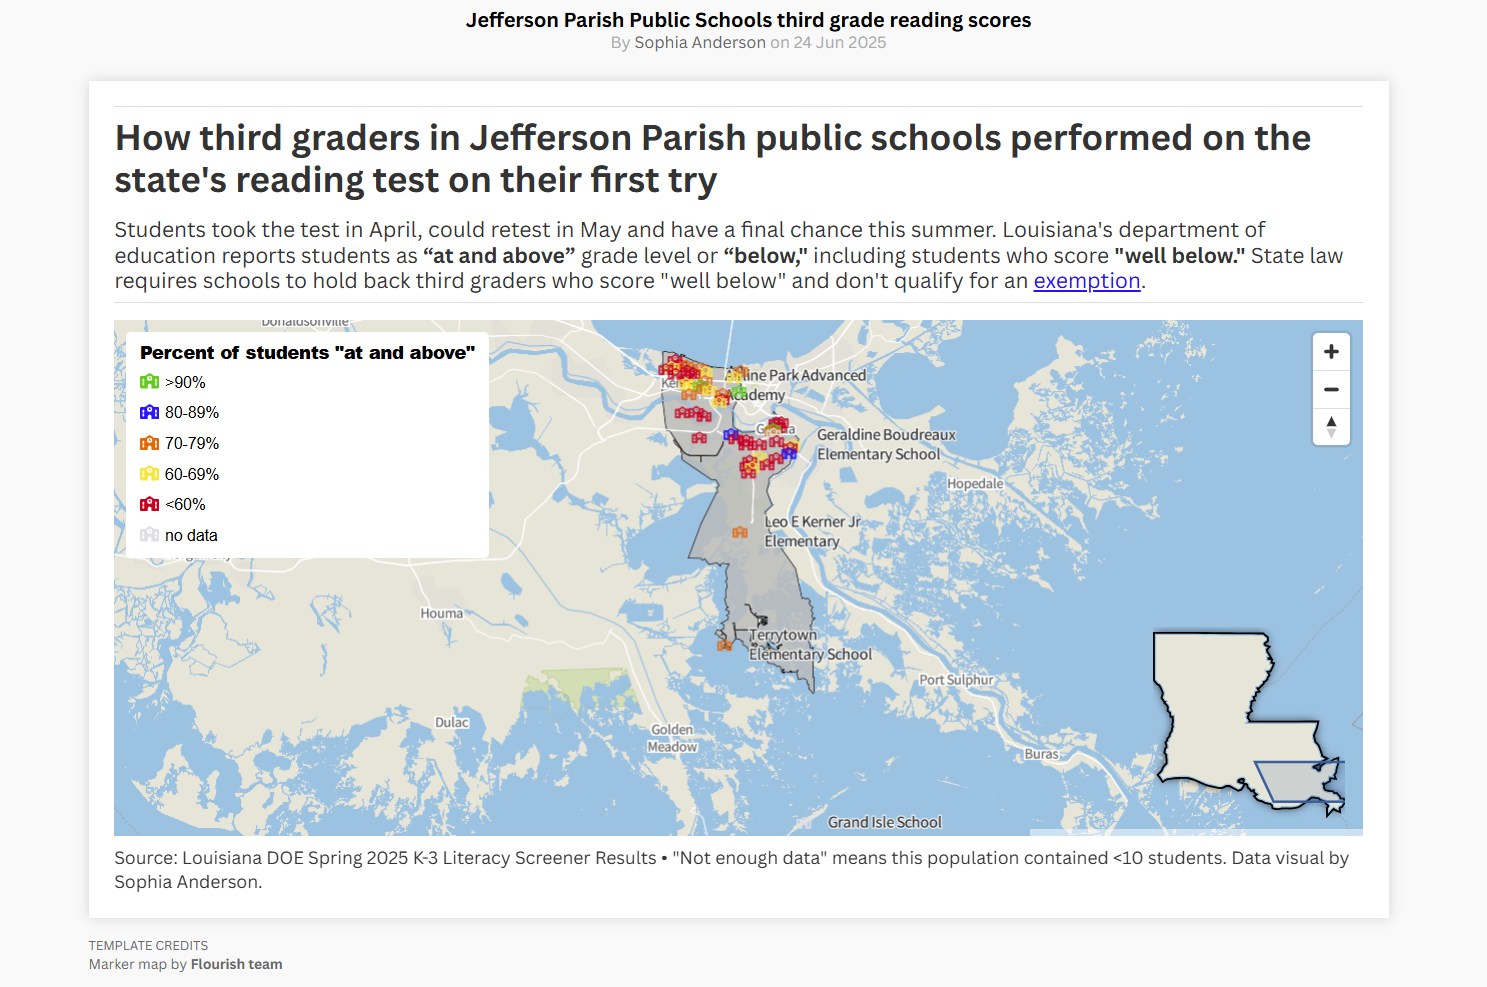
Integrating data visualization into a reporter’s workflow
Finding tools and methods that work for your newsroom.
Simplifying newsroom onboarding
How to get newsroom staff on the same page on cheat-sheets and documentation.
News through animation can improve memorability, engagement
A conversation with Mike Beaudet.
Four tools to create animated news explainers
Experimenting with VideoScribe, Adobe Express and more with Mississippi Today.
Using zines to share public service, civic information
From printing on a budget to distributing strategically: what you need to know.
Tips and tools for building an impact report grounded in your mission
A conversation with Sarah Luyengi from Borderless When creating impact reports at Borderless Magazine, Sarah Luyengi, operations associate, said she thinks about an aspect of the news organization’s mission: Community is at the center of everything they do. In a recent interview with the Innovation in Focus team, Luyengi defined impact as how Borderless consistently … Continued
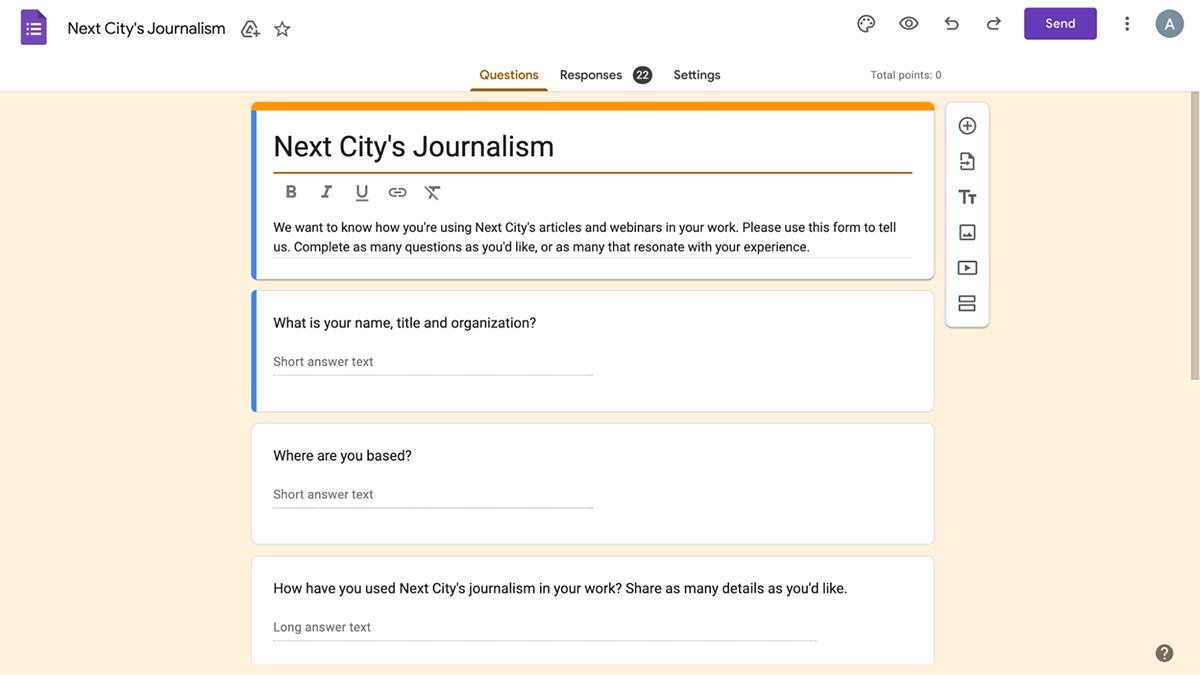
How Next City collected impact stories from readers
And impact takeaways from Borderless Magazine and Tradeoffs.
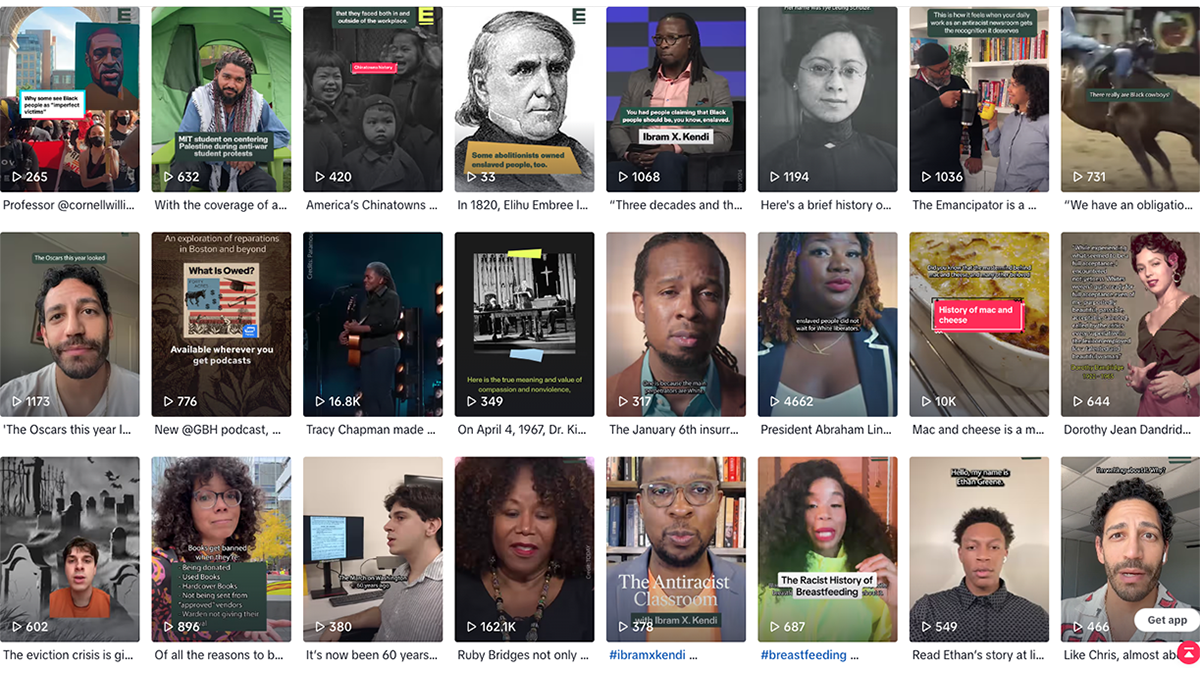
Finding what works for your community on TikTok
A conversation with Melissa Clavijo, The Emancipator.
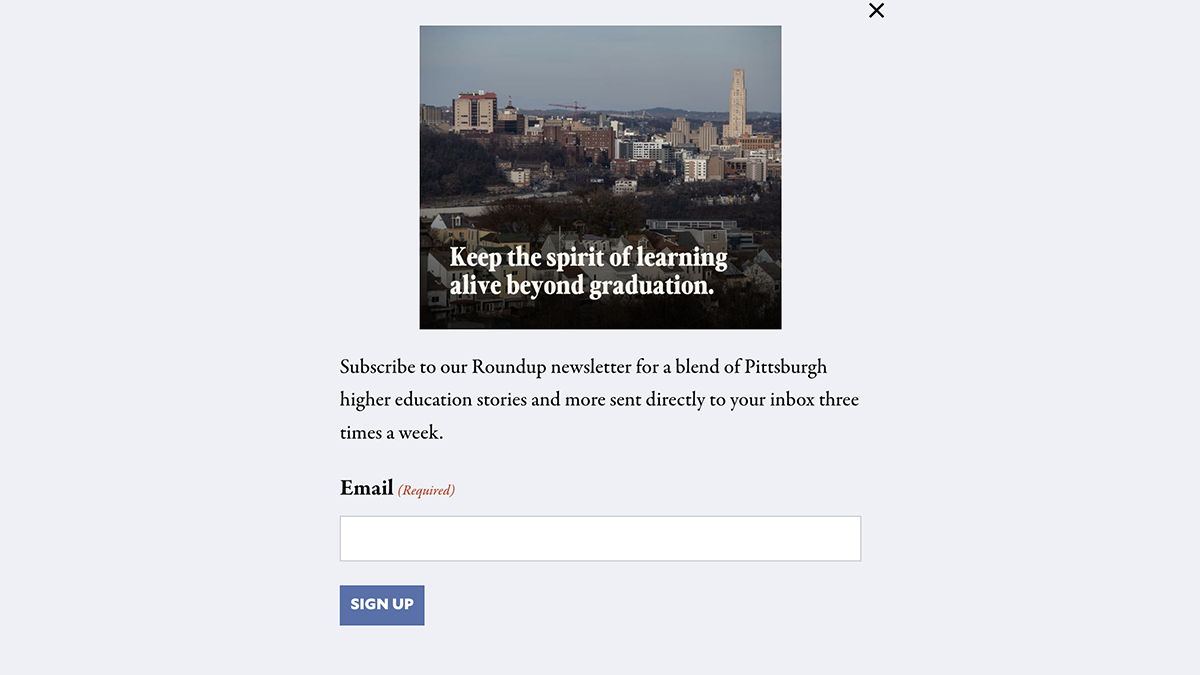
How to deepen the impact of newsletter call to actions
A few wording, colors, style changes to increase subscribers through PublicSource newsletters.
How to get noticed by a job recruiter and beat the automated hiring systems
A conversation with Eric Rubin, a Senior Recruiter for News and Sports at Warner Brothers.


