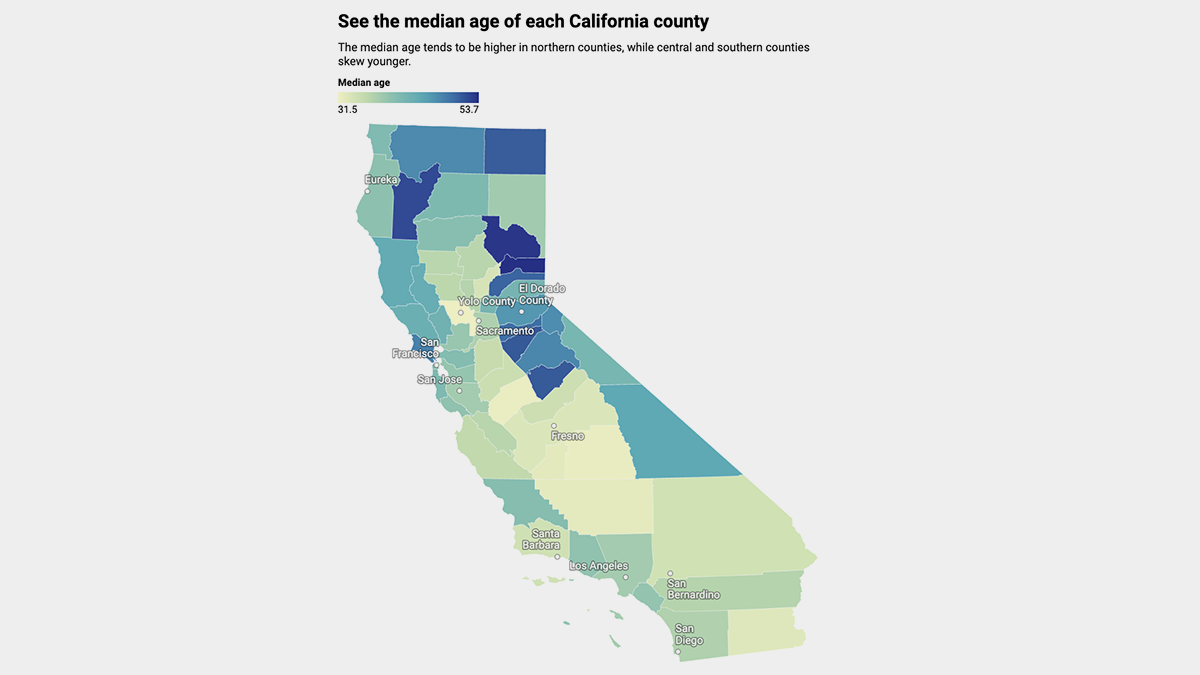
Tag: datawrapper
Training a newsroom on data visualizations
Creating an accessible, comprehensive guide to data viz for reporters at all skill levels.
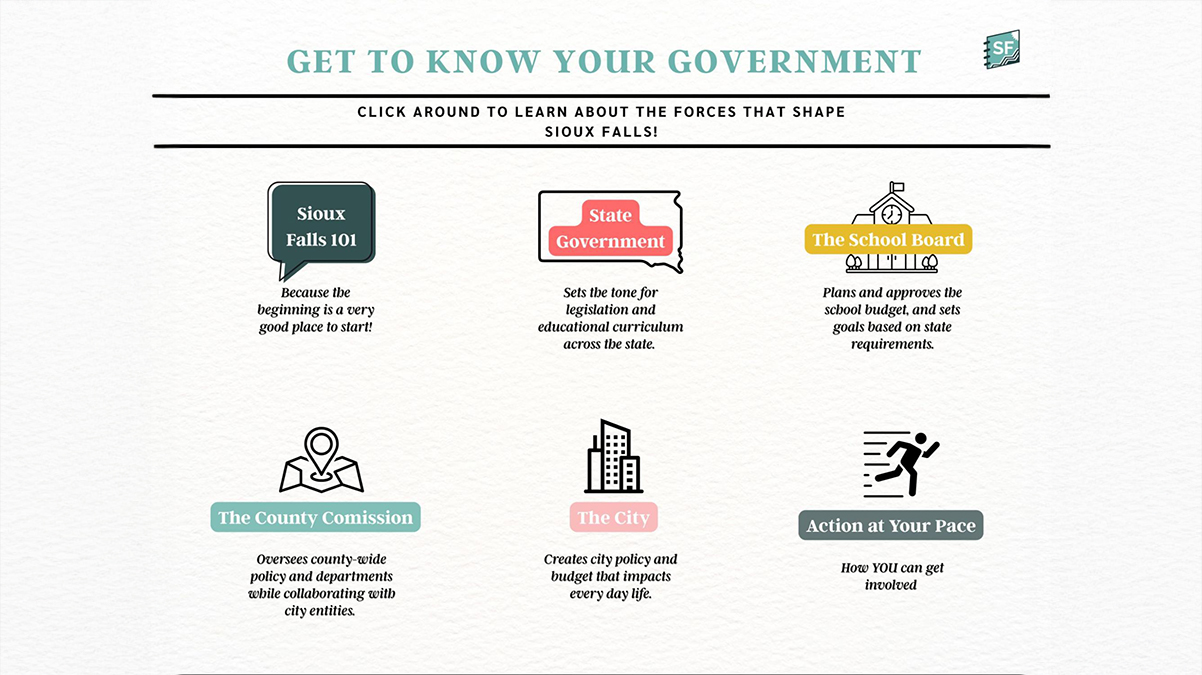
Building a civic health guide that inspires action and education
Lessons learned from creating Sioux Falls 101.
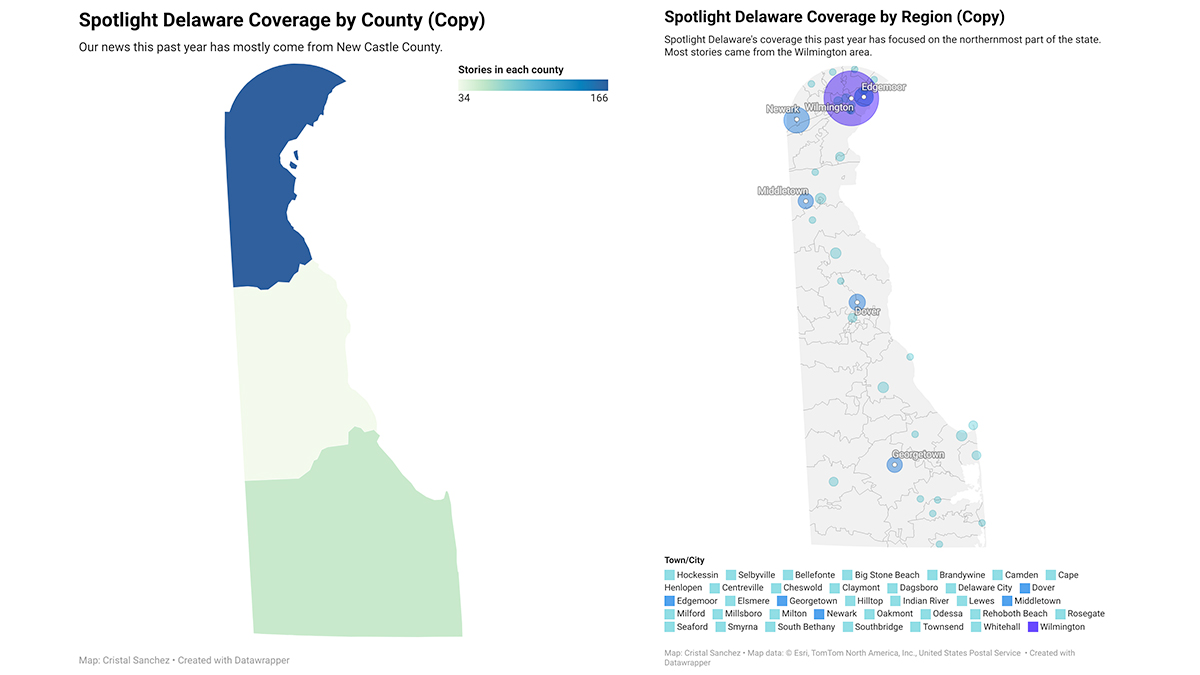
Solutions for auditing sources in small newsrooms
Including tools and strategies to evaluate geographic diversity of coverage.
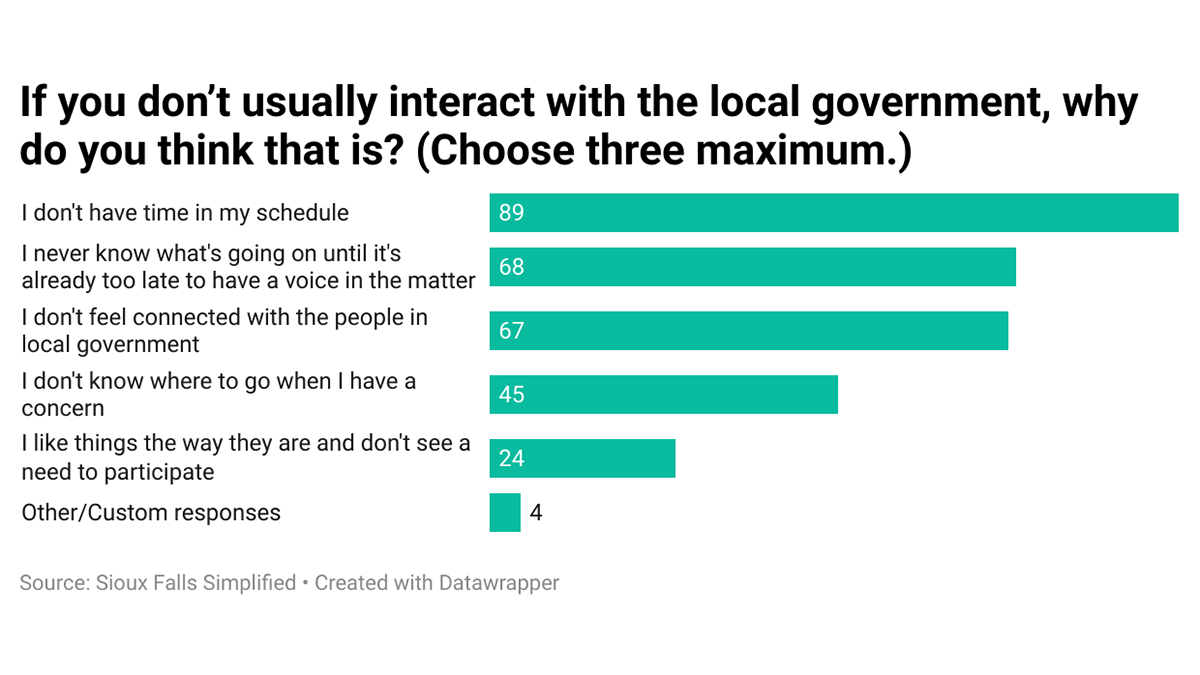
Simplifying civic engagement with local government
Hello from Sioux Falls, South Dakota!
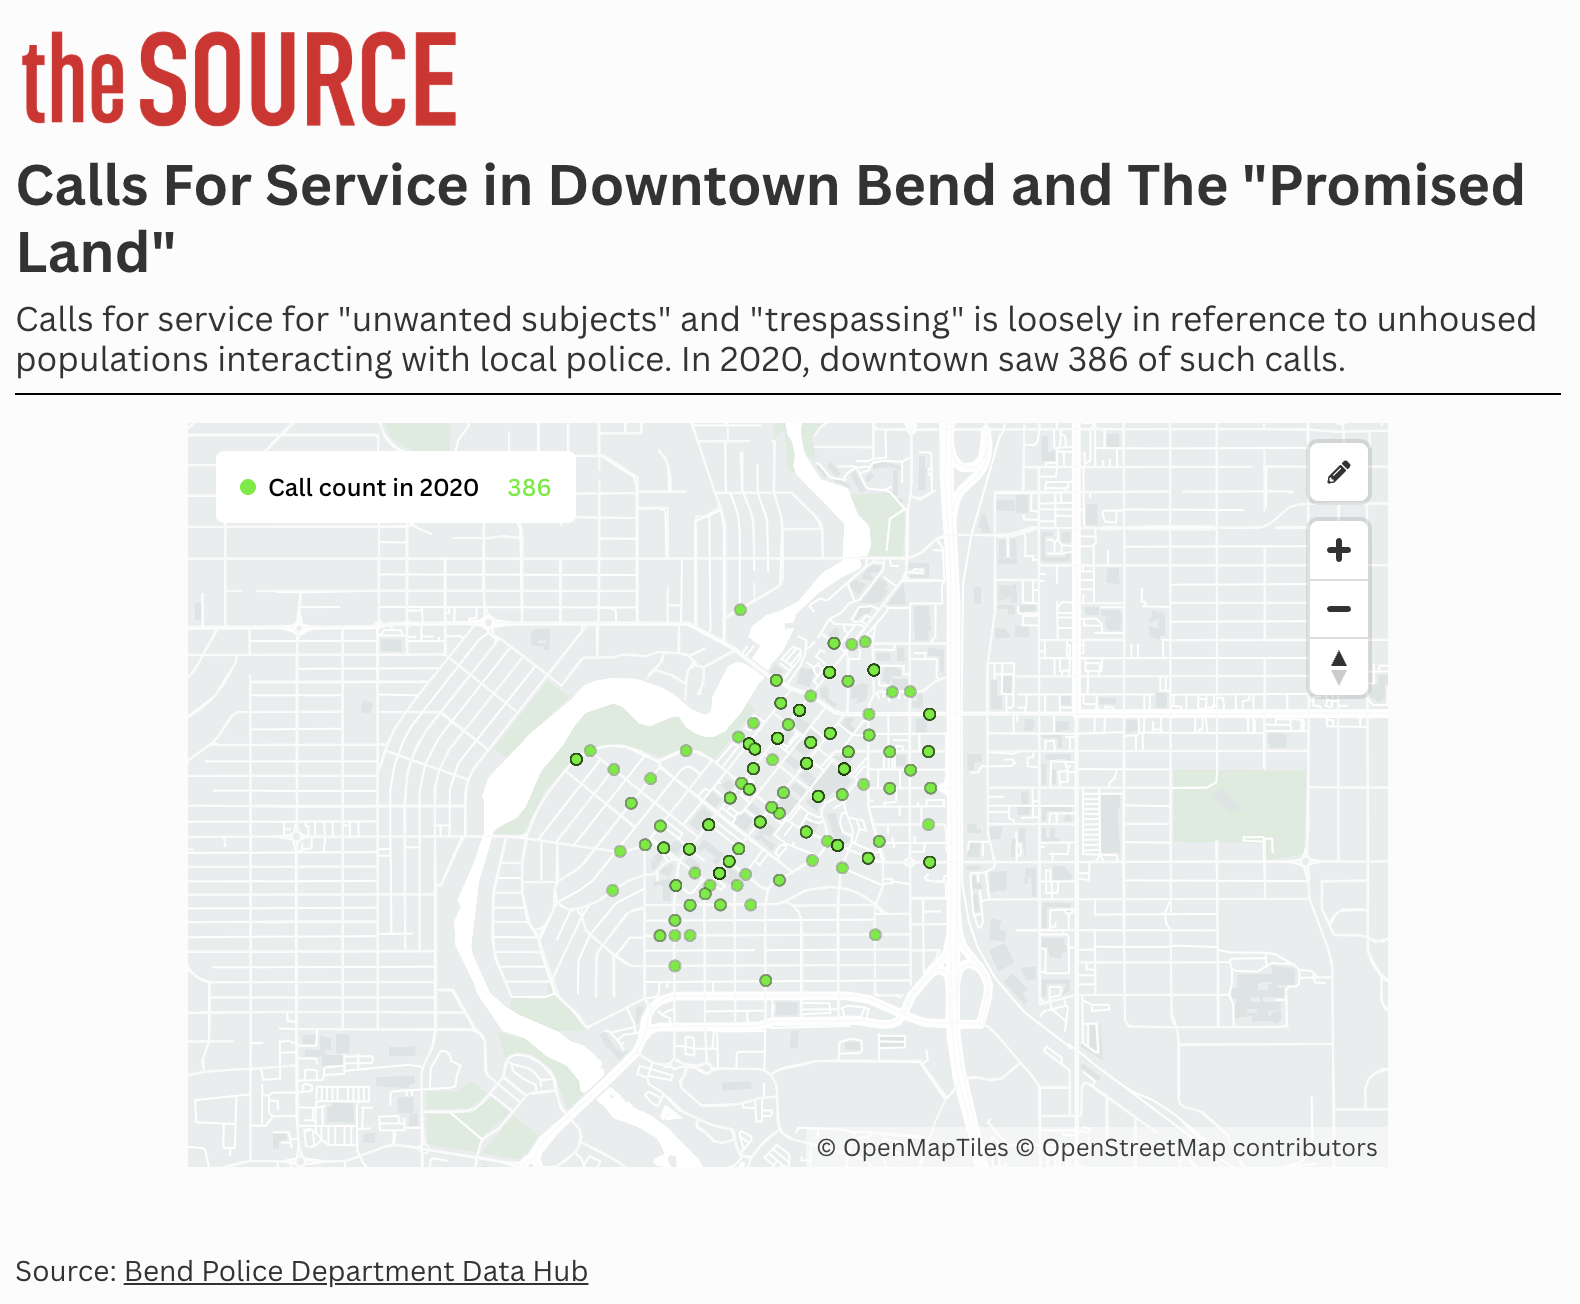
Fact checking police claims about crime with data maps
Identifying the influx of one local police department’s calls for service.
Integrating data visualization into a reporter’s workflow
Finding tools and methods that work for your newsroom.
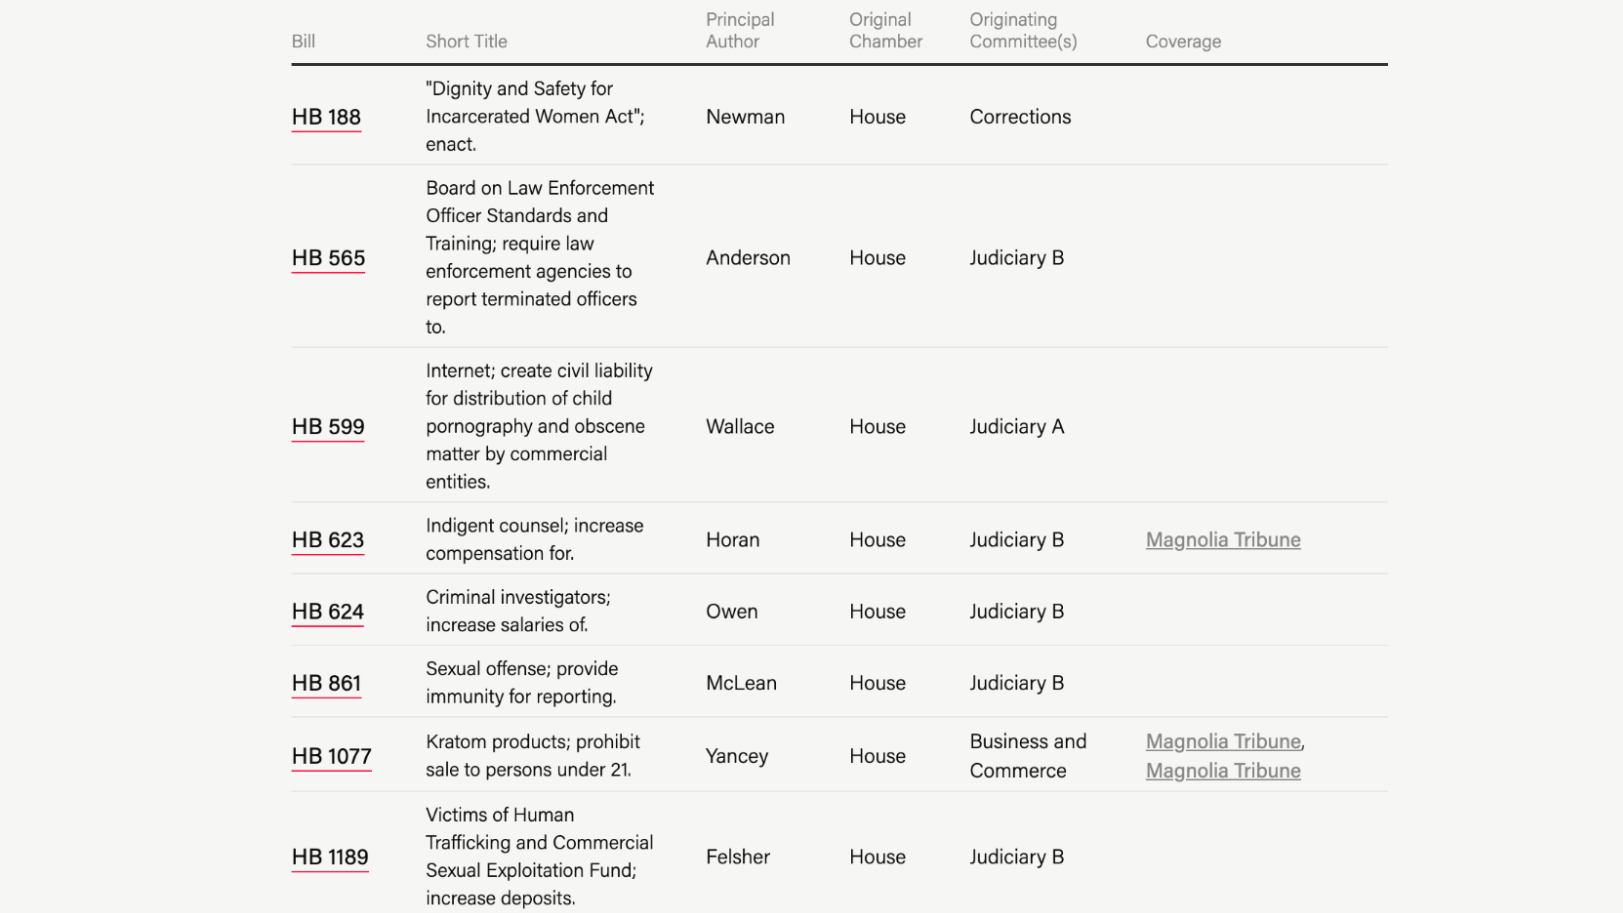
Using public state data to build a bill tracker
A conversation with Caleb Bedillion of the Marshall Project.
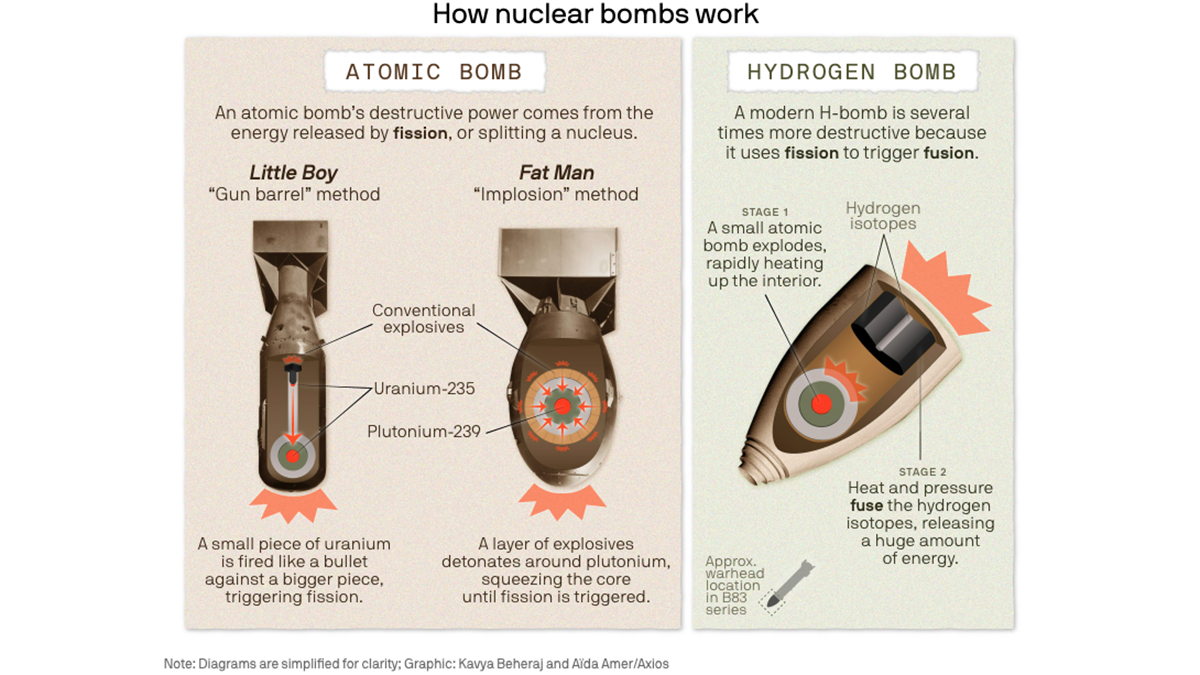
Explaining complicated ideas, processes with digestible and impactful graphics
A conversation with Kavya Beheraj, Axios.
Making Census data accessible for reporters with varying data literacy
Your guide to variables, visualizations and more.
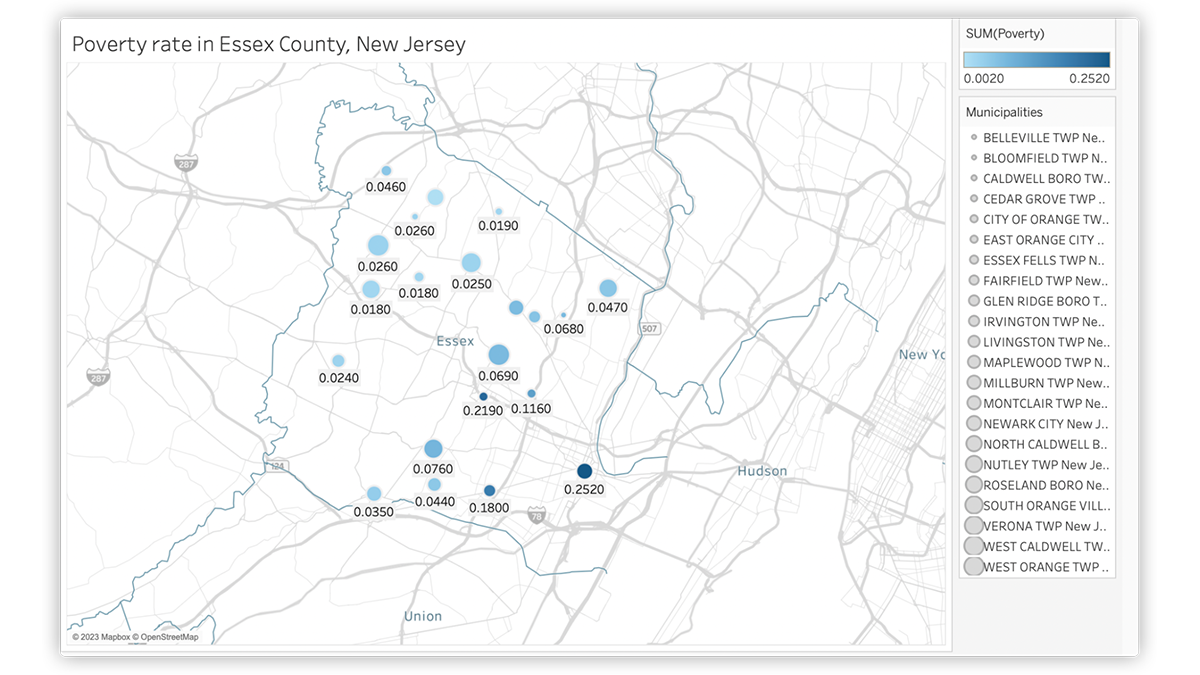
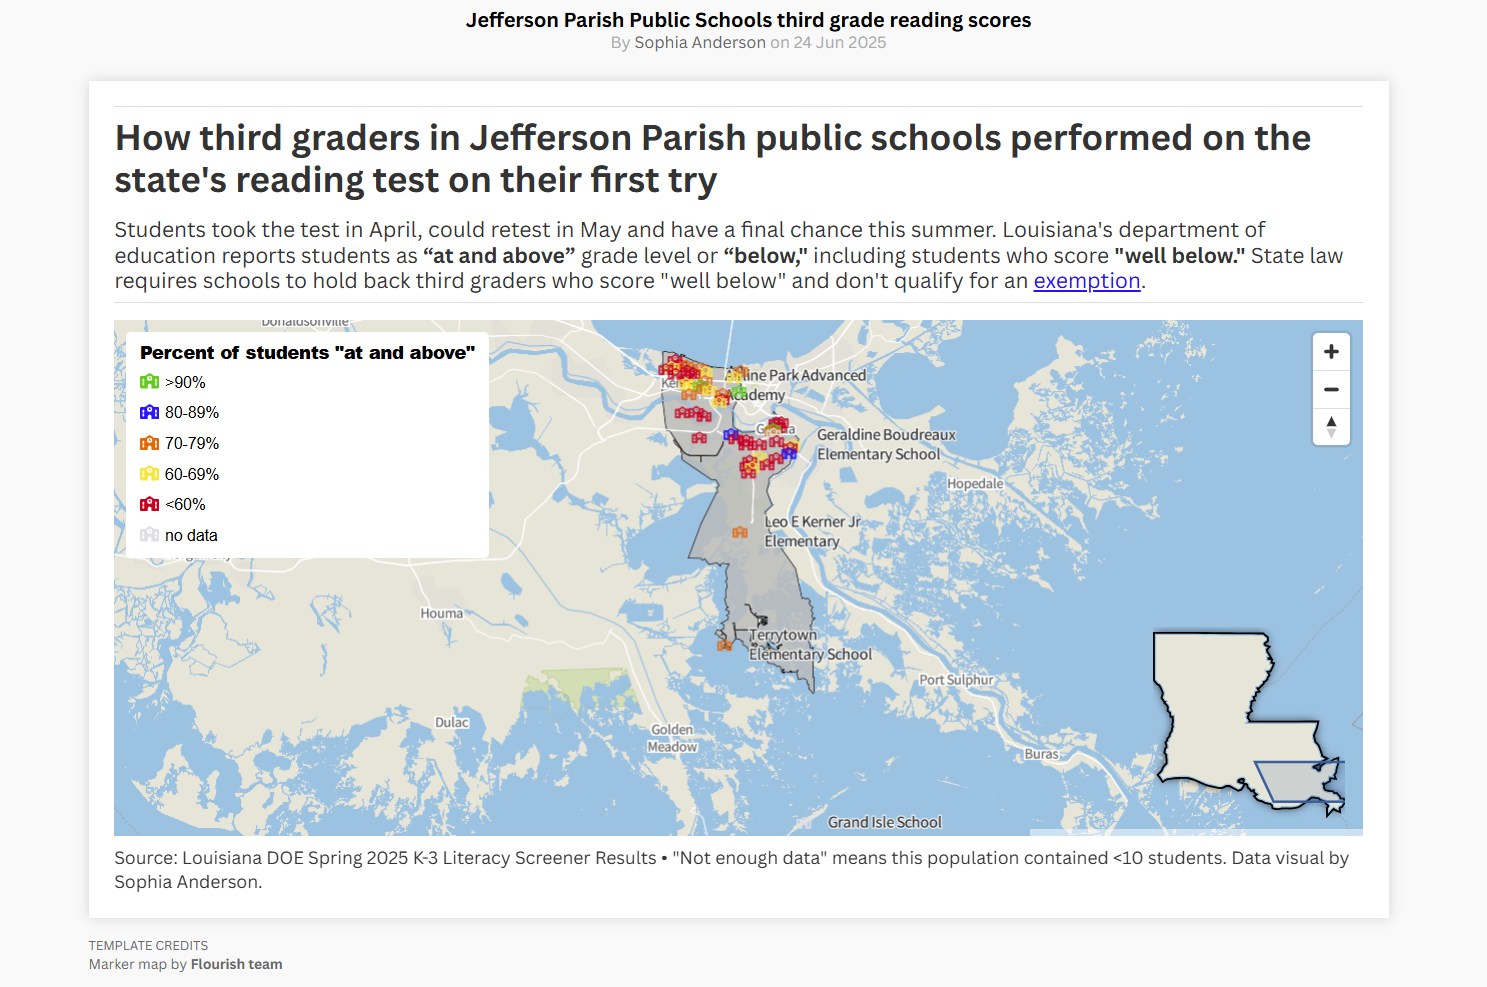
Building interactive maps to more equitably serve community
Bloomfield Info Project created community level maps to establish baseline tools to guide coverage decisions.