
Interactive experiences: personalization and revisit value

For this Innovation in Focus, we spoke with Financial Times Data Reporter, David Blood, and Senior Developer, Ændrew Rininsland, to learn about how their interactive work has progressed, lessons learned, and see where they’re headed next.
Greenway: How did you get started with interactive experiences?
Rininsland: I’m a life-long web nerd and have been building web pages since my early teens. Journalism has always been my primary focus though, and I eventually went to school for an interactive journalism program that was well-suited to use my computer skills in a journalistic capacity. The program taught me about news writing and features, but it wasn’t until I was in the industry for the first time that I had the freedom to approach storytelling in a truly creative way. What really interests me is the ability to find new and novel ways of telling stories that you simply can’t do with text and pictures.
Blood: Not dissimilar to Ændrew, I’ve been interested in storytelling on the web for as long as I can remember. I had experience in non-journalism fields that were all pretty relevant to the work that I do now. I trained as a filmmaker and worked as a video producer so telling visual stories was something I learned to do early in my career. After a few years, I moved into database and website development for nonprofits and educational institutions, which is where I first started working with data and content management systems. However, I didn’t have a background in coding when I began my Master’s in digital journalism. I wanted to learn to make data visualizations, and it quickly became clear that learning D3 was going to be a huge component of that. There were also some prerequisites to working with D3, namely being very comfortable with HTML/CSS and Javascript. That’s what really gave me the kick that I needed to develop those skills.
Greenway: Could you describe your team at Financial Times work and how it has evolved?
Rininsland: Sure, we were formerly referred to as the interactive graphics team. Now we’re referred to as the visual and data journalism team. This change reflects a lot of the ongoing changes to the breadth of work we do. We do interactives some of the time, but we also do a lot of data journalism. It really varies depending on the project.
Greenway: When and how do you decide that an interactive game, graphic, or video is the best way to present a story?
Blood: The way that interactive pieces are decided upon at the Financial Times, they need to have at least one of two things: one is the ability to personalize or to explore data to make it more relevant to the user. For example, you might have geospatial data and you want people to be able to see what that data tells them about where they live. The other primary prerequisite to an interactive is having revisit value so, rather than a one-time visit, a reader might make repeated visits to the story. Those have been the main two criteria that I’ve observed.
People like Ændrew and I that are into the more creative and dynamic side of web technology are keen to experiment with new visual formats. I don’t think interactives have to solely serve the purpose of visualizing data. I’m thinking of examples such as the New York Times’ ‘How the Virus Won’ or Washington Post’s interactive tour along the U.S. southern border. Those were both phenomenal ways of telling the story. They looked great, and they feel great to use. They were engaging as well as hugely impressive pieces of engineering. It’s fine to write 800 or 1,000 words if all you want to do is deliver the information, but people can go on Twitter, follow journalists, and get top-line news for free. If you’re charging for news, I think you need to go beyond just providing information. If you can delight a reader with your presentation, that reader is going to be more engaged and impacted by the story you are telling, and I think that’s a consideration that’s often overlooked.
Greenway: Could you talk about some of your audience reactions to these projects?
Rininsland: The Coronavirus tracker is a good example of this. It started as a static page where John Burn-Murdoch was working through a lot of new data every night. There was a lot of ongoing data work but it wasn’t interactive yet. We effectively got a lot of really good user feedback and John was really shocked by its popularity. People were asking great questions such as, “But what if you changed the graph to be two per capita…?” To receive engaged questions like that was really something and was the major reason we [made the data interactive]. We wanted to be able to give users the ability to investigate the data in a particular way and answer their own questions. We often don’t reach for interactivity very readily because it does add a lot of extra overhead to any project. Usually, we have to have a very specific user need before we do anything interactive and I think that was a really good example of designing a static page to a very interactive one from user feedback.
Greenway: What kind of software or tools work best? Are there any tools that may be best for a smaller newsroom looking to get started in interactive work?
Rininsland: We are very much a React shop, heavy D3 shop and JavaScript in general. That extends to the broader graphics team working with static design. If we’re doing interactive maps, then we use Mapbox. One thing that’s helped over time as we’ve done more and more of these projects is that we’ve built a library of reusable code for certain components.
Blood: Yeah, we build everything with JavaScript. In general, in regard to smaller newsrooms or newsrooms just getting started in this space, something that we’ve learned over many years is that it’s sensible to minimize the amount of tooling that you bring in house. It might be sensible for a smaller outfit, for example, to use something like Create React App rather than build their own page scaffolding tool as we did.
Greenway: You’ve mentioned a bit about the maintenance and overhead of your projects, and that’s certainly something that newsrooms factor in when developing projects. What other advice would you give smaller newsrooms?
Rininsland: In terms of maintenance, one thing we’ve started doing is setting a cradle-to-grave timeline for projects. When we’re in the initial stages of planning for an interactive project, we’ll look at the life-cycle of the project and what long-running resources we will need to maintain that timeline.
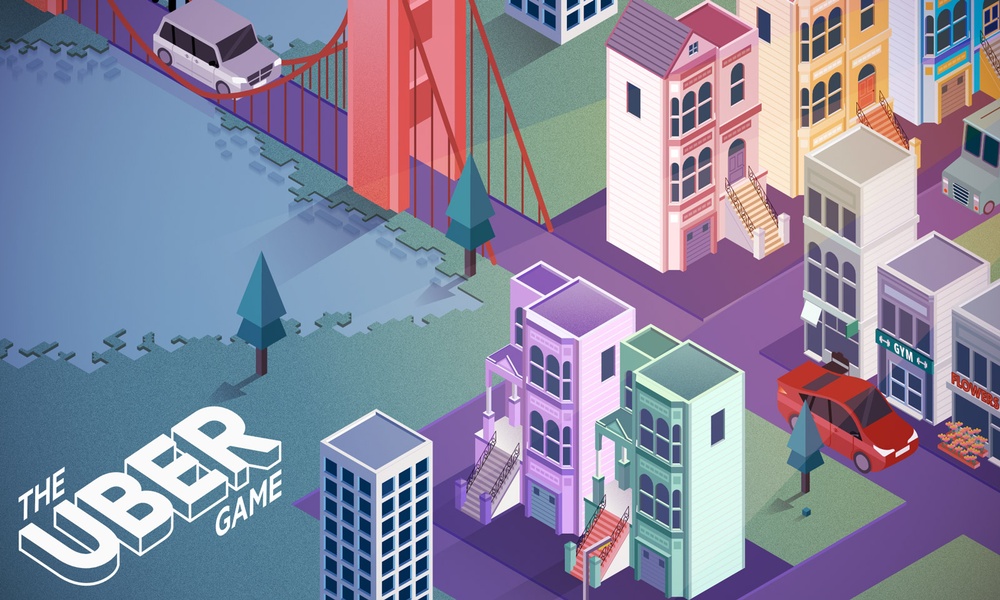
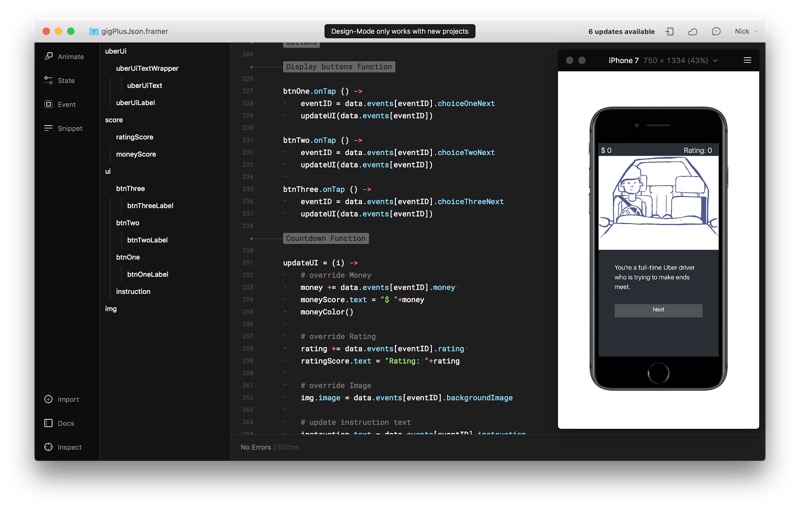
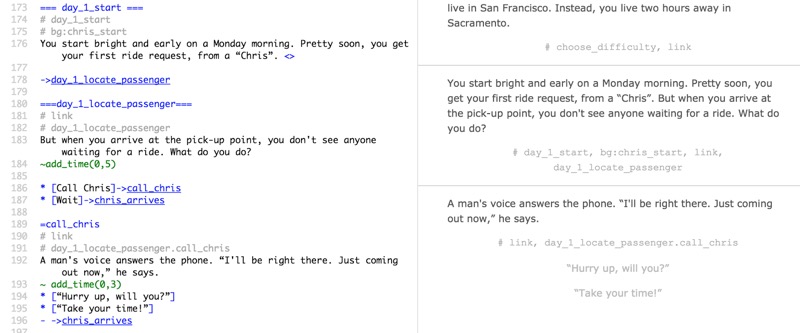
One thing within the Uber Game, for example, was the final results page. When you get to the end of the game, it tallies how much money you made, the decisions that you made, and what not. Every single one of these decisions that you make along the way is recorded into a database so that, at the end, it can give you a comparative number such as “You manage to make ‘n’ amount of money. That places you into this percentile of earners.” Initially, we did all of these calculations live. Eventually, however, we had enough data that it could be done in the web browser, which was part of the life-cycle for that project.
Long-running technical resources are expensive, so early planning helps figure out how to keep some degree of functionality long-term but also be able to deplete any sort of live resources over time. If you have a server or database that’s running, you’re paying for every minute that it’s live.
Greenway: What do you see as new in terms of interactive projects in the industry today? What’s next for you and your team?
Rininsland: There is a lot of discussion about the changes within JavaScript but, for the last five years, React and D3 have been the go-to tools from what I’ve seen. Something that I’ve seen is increasing use of WebGL as a trend. However, I think the only major shift in terms of approaches have been been focused on 3D visualizations. Blender is definitely something I want to learn next.
Editors note: Interview has been edited for clarity and length.