
The final interactive map includes a headline, caption and credits at the bottom.
Combining historical and current day journalism in an interactive experience


South Dakota Public Broadcasting used archival maps, audio stories, photos and other content to combine reporting on survivors’ stories
June 9 marked the 50th anniversary of the 1972 Black Hills Flood in South Dakota. To commemorate the anniversary, South Dakota Public Broadcasting has been working on a landing page that includes audio stories of the survivors and a full-length documentary. We worked with SDPB to edit the audio and build the interactive map experience that puts the survivors’ stories together for the anniversary landing page.
Editing audio
Before the map could be created, we had to go through the almost 30 interview clips that ranged from around 20 minutes long to over an hour. We chose the 11 that we did because they were not featured at all or only in parts in one of the other storytelling methods. Once we narrowed it down to those 11 survivors’ stories, the audio clips were uploaded into Adobe Audition for editing.
Once the audio clips were ready, they were then transcribed so that we could take pull quotes and input them into the map along with the survivors’ photos.
Creating the map
We were given a historical PDF map that shows the flood proximity and locations of where the survivors were interviewed. We used a georeferencing feature in QGIS, a free mapping tool, to align the historical map with a current day map so we could plot survivor locations using latitude and longitude.
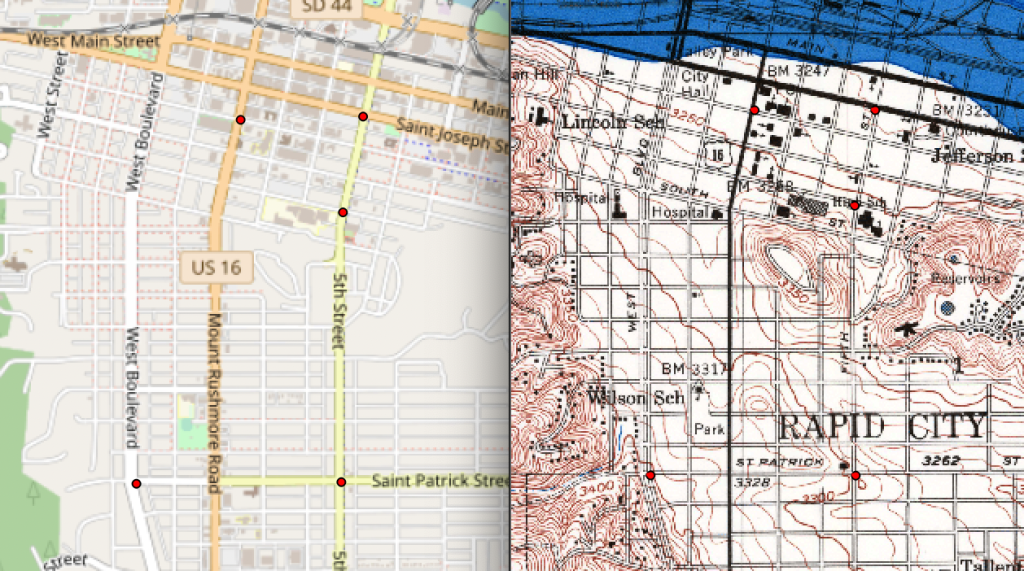
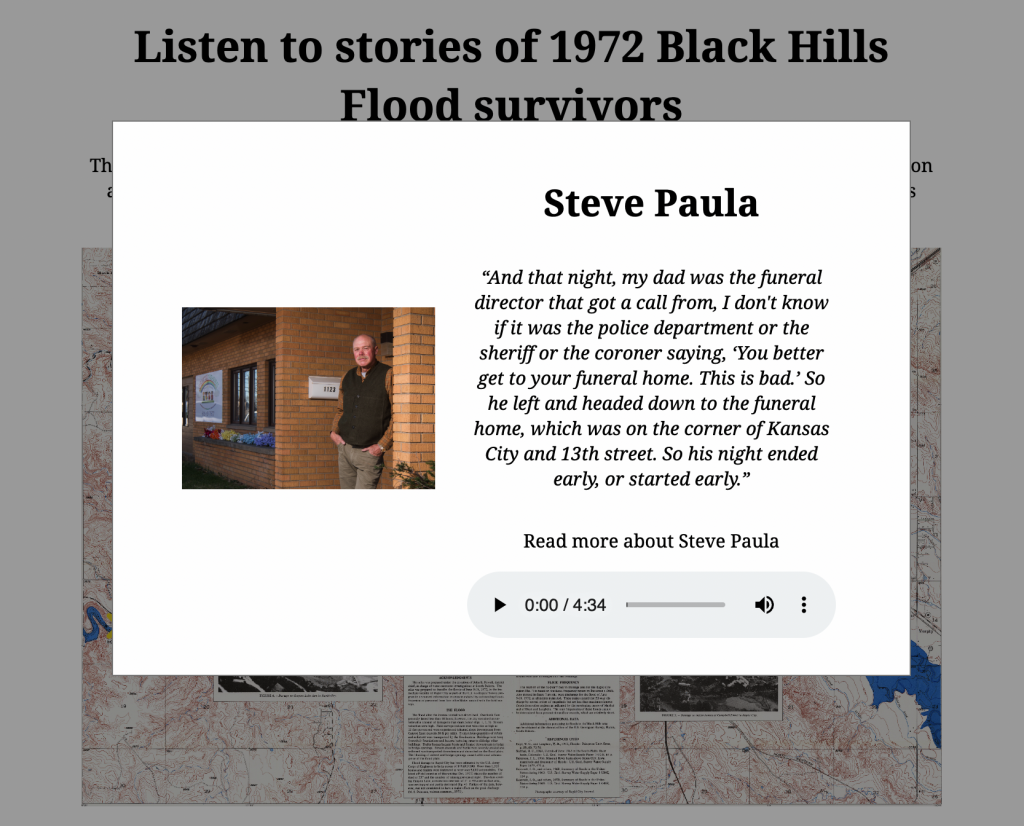
After adding the yellow marks to point to survivors’ locations at the time of the interview, we saved the map as an SVG. We then used the SVG to make the marks clickable with Javascript. When a reader clicks on a mark on the map, a box (also called a modal) will pop up with the survivor’s image, name, a quote excerpt, a link to their spot on the website and the edited audio.
Journalists as historians
SDPB’s project strived to give a voice to the people impacted by the flood in several different mediums from audio to text to video to our interactive map. Together with SDPB, we took extra care with editing stories and creating an experience that will continue to live on through future anniversaries.