
Emily Hood presents her proposed projects to reporters and editors in the Star Tribune’s office in downtown Minneapolis. Photo: Sydney Lewis
How to gain buy-in and knowledge before building a news product

Emily Hood is a 2023 RJI Student Innovation Fellow partnered with Star Tribune in Minneapolis. The RJI Student Fellows will be sharing their innovative work through Innovation in Focus.
As many news organizations continue to shift to a digital-first workflow, reporters and editors often lack analytics that capture the outlet’s full digital audience in one place.
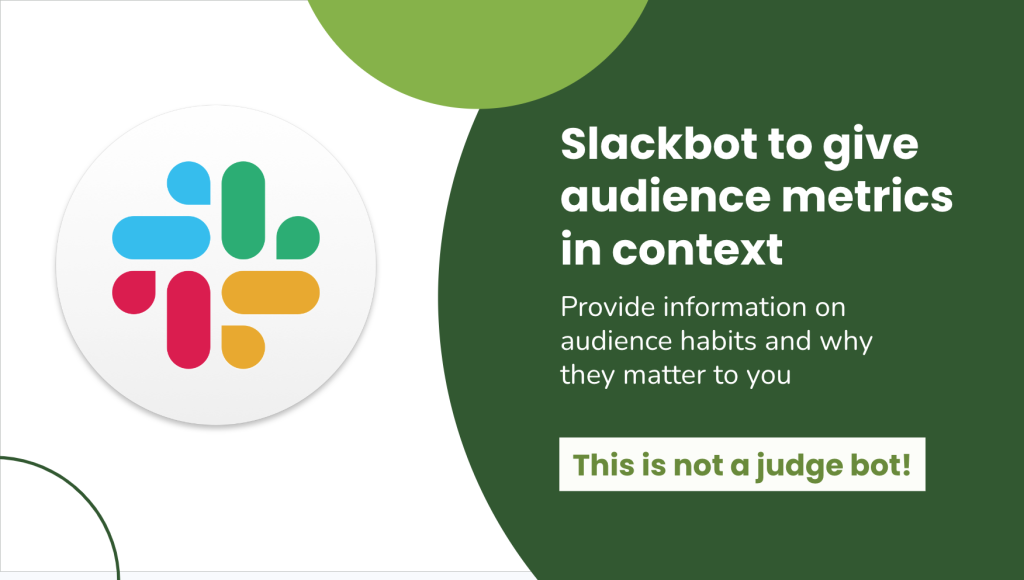
At the Star Tribune, we will be creating a Slackbot to generate audience analytics reports. These reports can better support the newsroom as they learn about their online performance and adjust their content strategies.
Because of the way the Star Tribune’s website and app were built, existing analytics tools like Chartbeat or Parse.ly do not capture the outlet’s full digital audience in an easily digestible view – so we are creating a new product to do that.
Before we could begin developing though, we needed to understand how the newsroom functioned to ensure the product would include the best functionalities for the newsroom.
Here are the steps we took to get feedback from our stakeholders, gain buy-in and create a scope for the project. While designed for this Slackbot, this guide could work for the development of any new product in a newsroom.
1. Get your idea in front of as many members of the newsroom as possible.
Whether you’re new to the newsroom or a longtime staff member, it’s helpful to get feedback about your project from as many people as possible — from the vice president of digital product to daily beat reporters. This allows you to share more about your background, expertise and goals for the product.
The Star Tribune hosts “StribU” brown bag sessions where they teach employees new skills and share interesting projects. During my third week, we invited everyone in the newsroom to attend a StribU session where they could talk about how they saw the Slackbot fitting into their jobs.
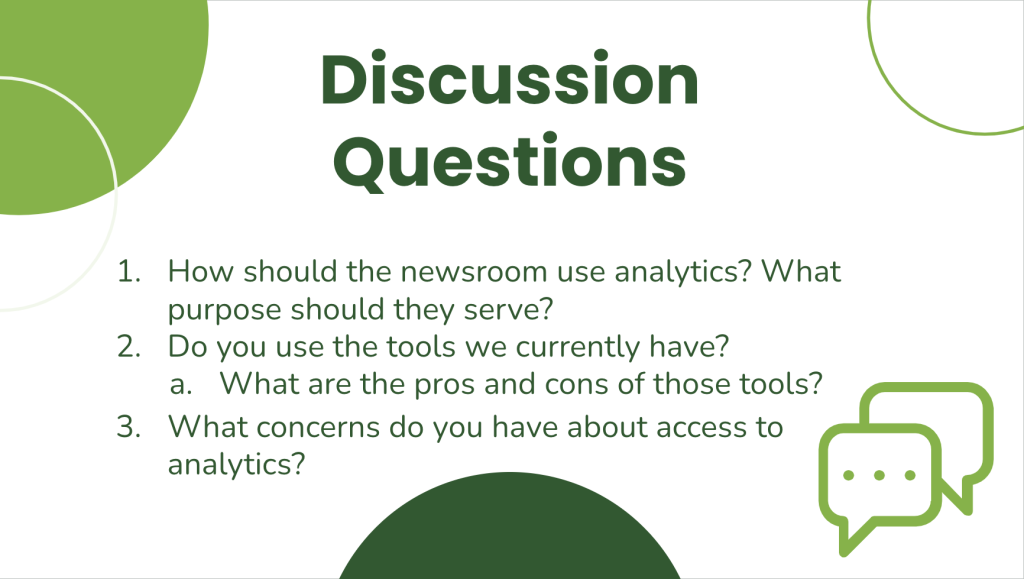
It was important these sessions were a two-way conversation. Before introducing the concept of the Slackbot, we asked attendees about analytics more broadly, including the role they felt analytics should play in their jobs. This helped us understand their decision-making process and what they felt was lacking in the Star Tribune’s current system.
By connecting with reporters and team leaders, we were able to focus the product efforts on functionalities that are most valuable for all members of the newsroom. We also learned that these brown bags help explain the value of the product and build buy-in. During our meeting, reporters and editors said they appreciated the opportunity to be a part of the conversation surrounding analytics in ways they hadn’t in the past.
2. Create a survey to understand broad opinions of the newsroom.
While a brown bag session can be helpful in identifying some potential themes and ideas to explore within the product, we found we needed data to better understand how the broader newsroom wanted to digest analytics. That’s where a survey came in.
We sent a survey to the entire newsroom to understand their knowledge of the audience, analytics access and preferred methods of communication. This information helped prioritize the types of reports this bot would generate, the data included in the reports and the ways it would be displayed in Slack.
When designing the survey, we allowed participants to quickly select a defined answer instead of typing their thoughts. This ensured the survey did not take too long to complete, while still meeting our goal of obtaining quick advice from a broad swath of the newsroom.
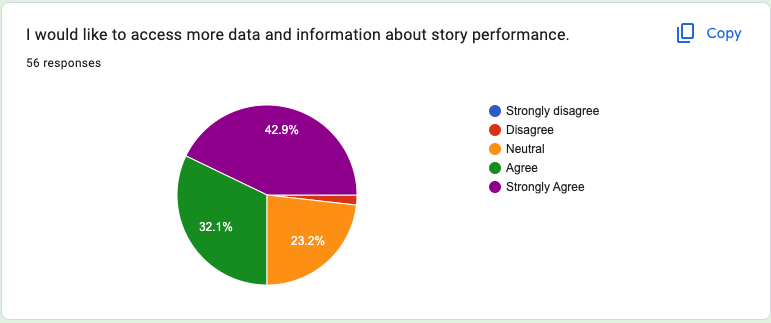
This survey gave us three pieces of valuable information. First, the newsroom is hungry for analytics. Over 75% of 56 survey respondents said they wanted more access to analytics than what they currently had. This meant we were spending time on a project that mattered to our stakeholders.
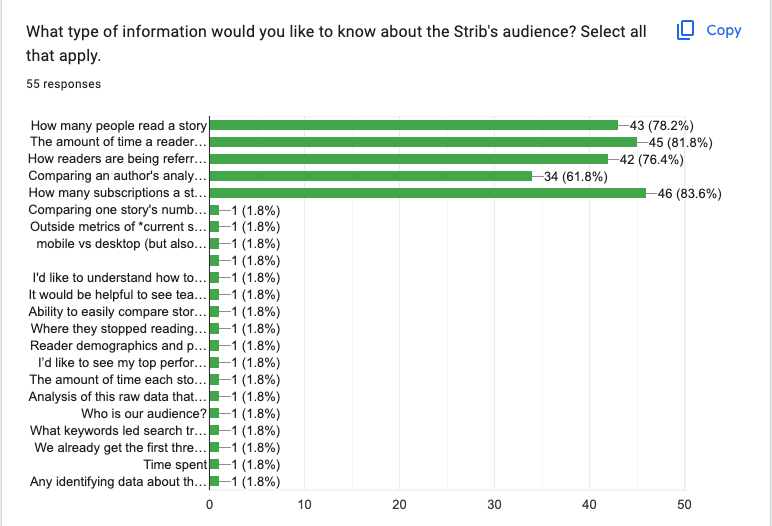
Next, members of the newsroom told us which metrics mattered the most to them for the Slackbot. This helped prioritize certain functionalities when scoping the project.
Finally, over half of the respondents showed some apprehension to the amount of Slack notifications they receive during a work day. This response discouraged us from sending automated reports into public channels. We wanted the bot to be seen as a tool — not another annoying notification to be ignored.

3. Reach out to individuals to learn their “why”
To gain a deeper understanding of the motivations behind creating stories, the next step was to individually meet with 35 Star Tribune newsroom employees. These meetings were with reporters and assigning editors from each of the paper’s four desks — metro, features, business and sports — to talk more about each section’s needs.
In these meetings, we talked about the purpose of analytics in evaluating job performance and how team members interacted with the current analytics tools. They shared about their reporting process and what analytics they lacked to do their job more effectively in a digital-first workflow.
Reporters and editors told me current analytics tools were difficult to access and too slow to generate reports. They explained which metrics would be useful in justifying future pitches. They emphasized the need for not only displaying metrics, but providing context on what they mean, what values are good values, and ways they could be improved. They stressed the need to see their metrics across a month, six months or a year to identify trends.
Learning about the days of these reporters not only helped prioritize the features in the Slackbot, but it included those who didn’t traditionally deal with audience analytics in the decision-making process, further building trust and buy-in for the project. These conversations taught us the motivations behind the job of a reporter in a way we couldn’t gather from survey results. This ensured every functionality we included in the bot supported their mission.
4. Use the MoSCoW framework to prioritize what is most important.
Now that we had learned the realm of possibilities for what this bot should include, it was time to figure out what was the most useful and possible for a minimum viable product.
The MoSCoW framework, introduced to me by Harpreet Sandhawalia, the vice president of digital product at the Star Tribune, was a useful tool. This framework breaks down product functions into four areas:
- Must-have: Non-negotiable functionalities that must be included.
- Should-have: Functionalities that are not vital to the project, but would make a big impact.
- Could-have: Functionalities that would make a small impact on the project and are not vital to its initial success.
- Won’t-have: Functionalities that are not required for the success of the project in its chosen time frame.
Using this framework, we determined two use cases for the Slackbot:
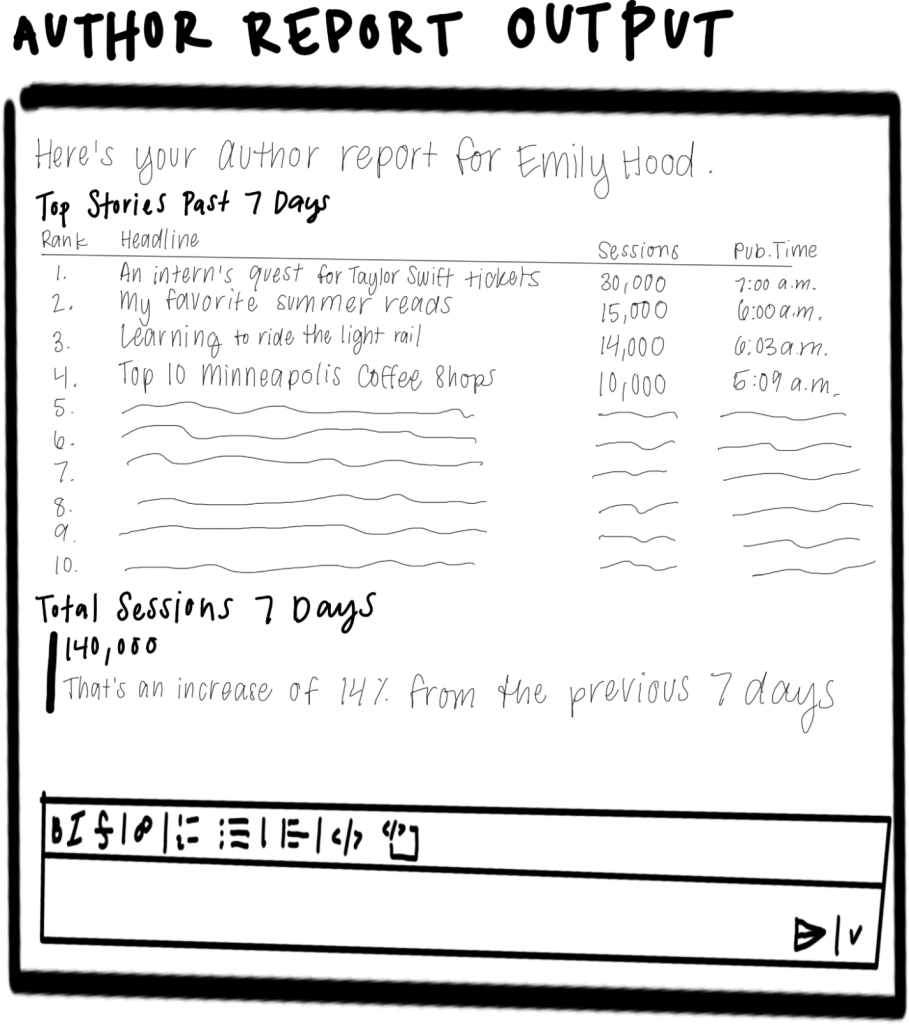
- Generating a report about an author’s performance over set periods of time like the past week, month, six months and year
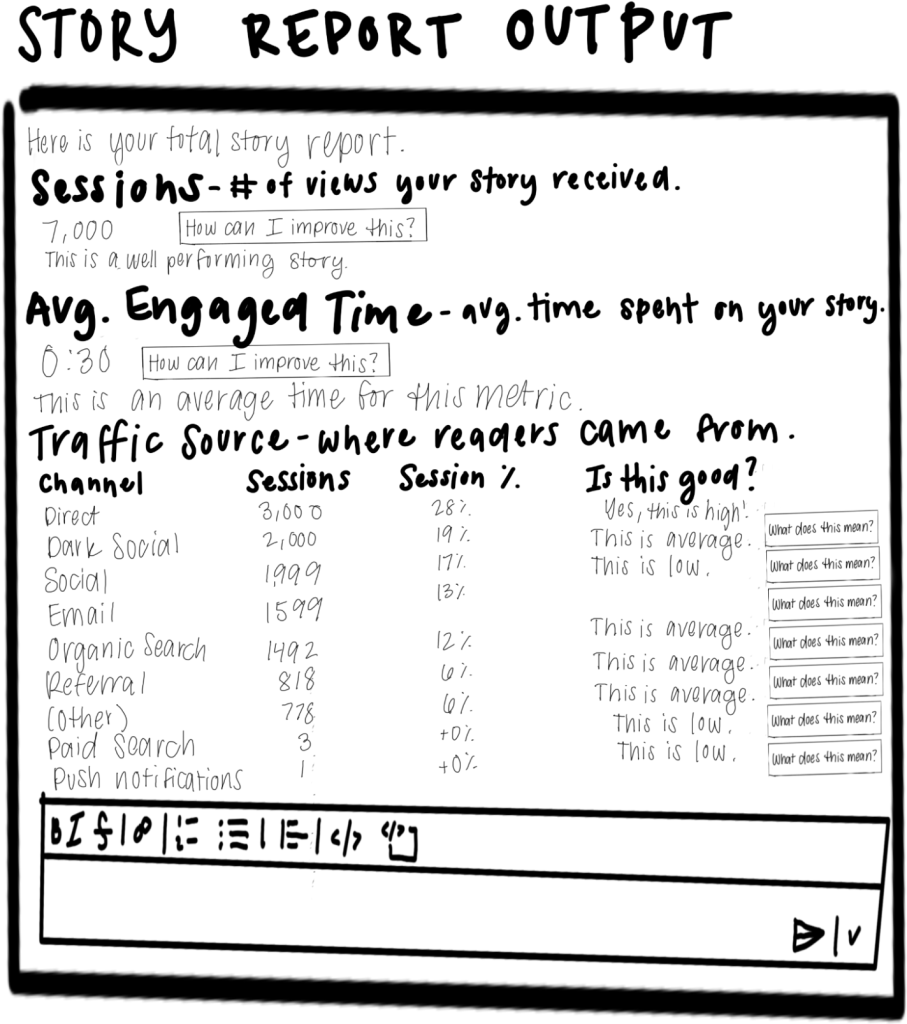
- Generating a report about a story 72 hours after its publish date, generally when a story has seen peak traffic
Data points we included in the must-have section included the number of page views a story received, the top 10 stories written by an author in the chosen time frame and a story’s traffic sources.
We placed data on subscription generation into the should-have category. It is more complicated to pull from Google Analytics, but makes a big difference in a reporter’s understanding of how they are contributing to the Star Tribune’s business.
Features like graphs showing metric trend lines were placed in the could-have category. They were useful context, but not crucial to create an easily digestible report for the time it would take to code them.
Won’t-have tasks included specific details on how a story was promoted, as there wasn’t an easy way to pull this data from Google Analytics.
Once these priorities were established, I placed them into a Google Doc and made a rough drawing of the outputs of each report. This helped us further picture what the final Slackbot would look like, and what I needed to learn to get to these final outputs.
5. Create a project roadmap to keep track of the progress.
Managing the scoping, production and rollout of this Slackbot required a lot of moving pieces and meetings. To make sure the project was moving along efficiently, I created a roadmap spreadsheet.
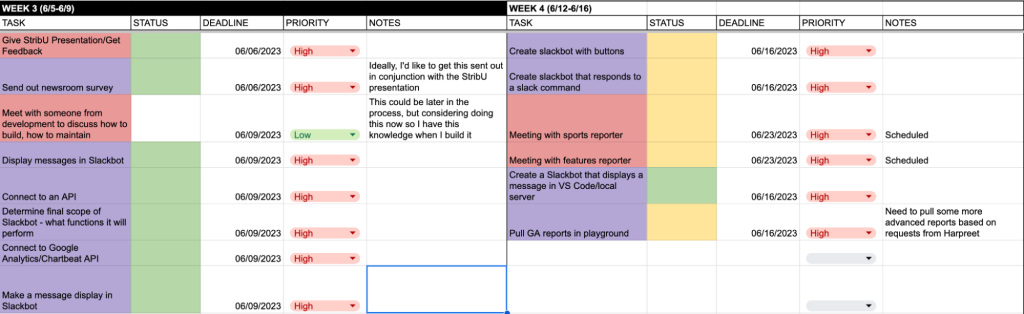
Find a templated version of this spreadsheet to download here. This template was created for a 12-week timeline, but can be adjusted depending on the length of your project.
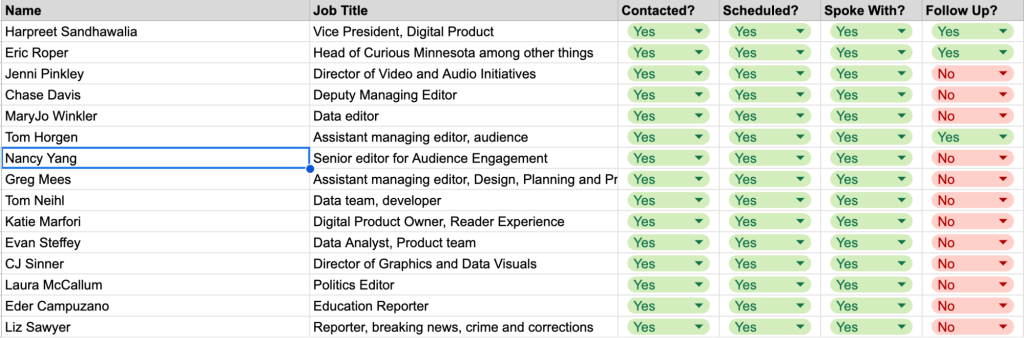
This roadmap includes the task and its deadline, owner, priority and status. It also features tabs to track who I’ve met with and questions that I need to answer at certain stages of the project. It was built based on guidance from the News Product Alliance. Each week, I update this roadmap as the product evolves and adjust some of its priorities based on conversations with my mentor to ensure that everyone is on the same page.
By following these steps, I was able to work with my mentors to develop a plan for our Slackbot project that was useful, executable in a short period of time and included newsroom stakeholders in every step of the development process.

Sign up for the Innovation in Focus Newsletter to get our articles, tips, guides and more in your inbox each month!