
Image generated by Wordclouds.com
How we establish a system for audience data across multiple outlets and audiences

Organizing unique data to tell the story
As part of the RJI partnership project with URL Media exploring the “currency of impact”, we are quantifying the unique relationship between community and BIPOC media outlets. Media organizations operate in multiple spaces every day, including social media, websites, emails and in-person where they interact with audiences and encourage engagement.
These activities generate a tremendous amount of accessible data that can be used to help build a model to quantify the relationship between BIPOC media and the communities they serve. But to dive deeper into this data to make it useful, we first had to clean and standardize it.
When we started we had a lot of questions about the data sets:
- How was the data collected and how can we collect it in a structured format going forward?
- What are their differences and commonalities?
- What logic shall we use to understand, organize and structure them?
- How to build a big picture view?
Rather than making predictions and conjectures about the data, we implemented a systematic analyzing approach.
Step 1: Extract quantifiable information
The data we started with originated in media kits that shared some data about the audiences, which was of great value in measuring media’s impacts on the audience or audience’s relationship with them.
We transferred the numbers and insights into a spreadsheet. During the process, we observed and identified potential connections in the data. Using Google Spreadsheet, we created sheets respectively for each media outlet, so that in the early stage of data collection, we don’t have to dig through a huge spreadsheet to find data and its corresponding outlet.
Next, we identified, defined and classified the data.
Step 2: Create a data normalization system
The URL media partners serve different communities and are located in different regions, so they have distinctive styles, including narrative logic, audience reaching channels and ways of interpreting their data. In most cases, we love to see the diversity, but when it comes to data cleaning and structuring, we need to prioritize uniformity to be consistent.
We aggregated all of the data in one large spreadsheet. When doing so, we mainly focused on discovering the commonalities among data and summarizing the categories that could be applied to define and classify across all the media outlets in a consistent manner.
Our unified spreadsheet makes it easy to navigate and observe any missing or outstanding data.
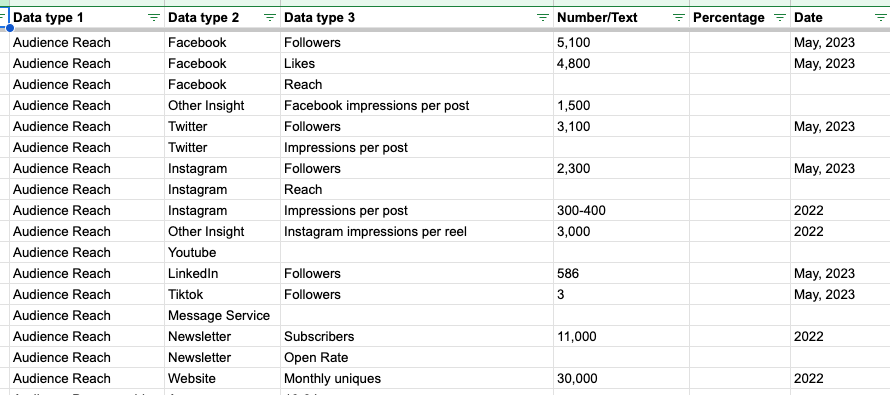
We categorized the data according to 3 types
We defined and categorized the existing data as type 1, 2, 3, etc. No data was changed, but the collated spreadsheet changed from the original to the following one.
- Type 1: data category (this can be audience reach, audience demographics )
- Type 2: data source (such as Facebook, Google analytics)
- Type 3: data source subcategory (such as Facebook likes, and Facebook followers)
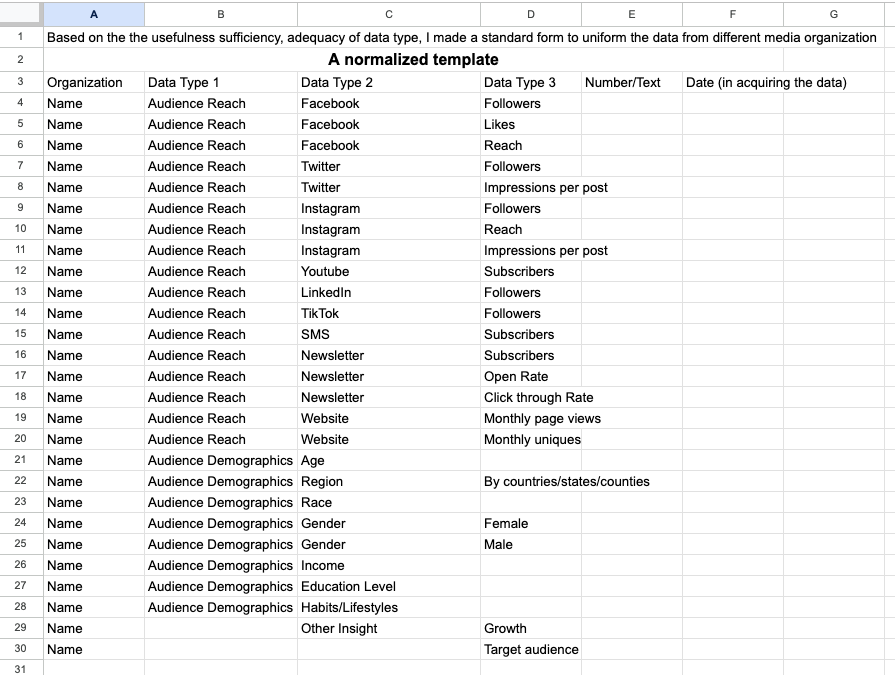
This essential step towards data normalization provided us with more room to analyze and utilize all of the data together.
First of all, each row only contains one data point. So from left to right, that is, from large ranges to smaller ranges, we can better understand the definition of each data point and the role it may play in our analysis.
Secondly, the types of data were also unified, for example as “Audience Reach” or by platform, which helped us collect the data out of the storytelling in different contexts and frame it in a more concise framework. We also removed irrelevant data and examined what the data really helps measure the connection between media and audience.
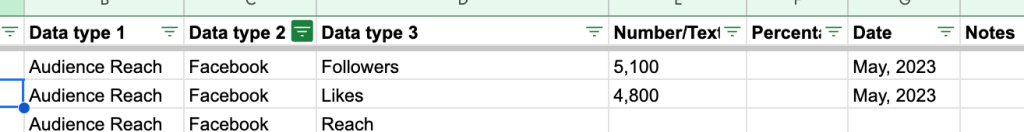
Finally, with the aid of Google spreadsheets’ diverse features, such as pivot tables, data visualization, and filtering options, we can efficiently examine specific data types within our standard structure.
As a result, we can swiftly aggregate, visualize, and emphasize any categories or data groups we are interested in, even when dealing with extensive spreadsheets containing hundreds of rows. Our use of data and the software empowers us to save our time and extract valuable insights.
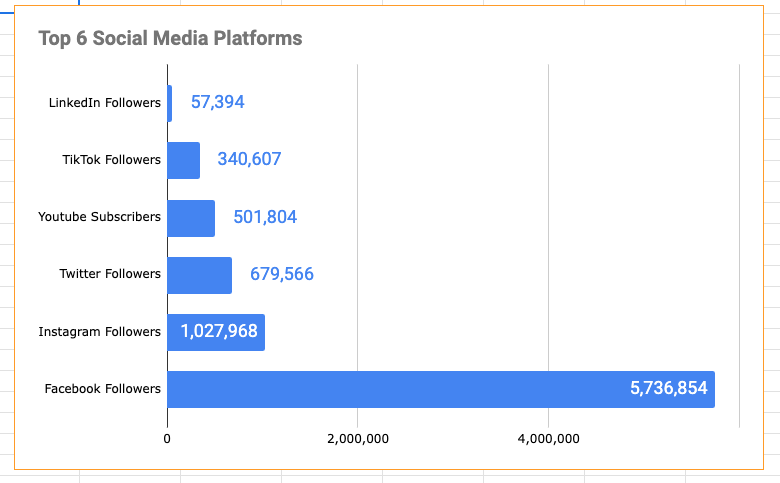
For example, by creating a pivot table and using formulas to compute statistics and then creating charts, we could visually learn how audiences and media communicate from the perspective of social media platforms. This visualization of the data enhances accessibility, enabling non-data professionals to effortlessly understand the data and communicate the impacts of the organization.
One of our interesting findings was the immense influence of Facebook as the total number of individuals following Facebook exceeds that of Instagram by a factor of five. However, the number of followers doesn’t tell the whole story. Looking at one of the organizations, we can see that they have around 406,000 followers, and they have 405,000 likes on their content posted. These reactive interactions can come from those following on Facebook or not, and require the audience member to actively engage with the content.
This provides more valuable insights than just follower numbers because a like or other interaction, such as a comment, reflects a stronger or higher quality relationship between the audience member and the organization.
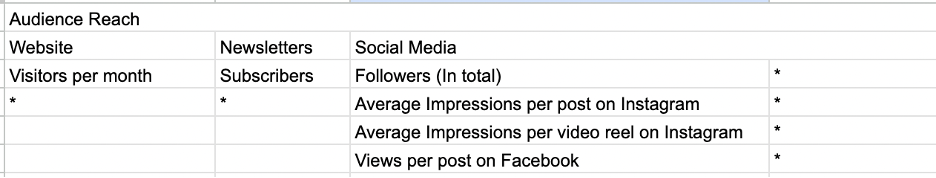
Step 3. Fill in the blanks
We then created a metrics template of all necessary and valuable data to help us understand the different media audiences from a comprehensive perspective. We made sure to include metrics such as “Reach” and “Likes” that provide feedback on how audiences interact with media.
Using our new template, we created a form that will enable normalized data collection and ensure the data is collected in a format that is easier to analyze in the future.
This sets the stage for new members joining the URL Media network adding their data in a manner that matches the existing normalized data system. We designed a corresponding question for each metric so that our partners only need to access the data and enter the numbers without bothering to create any text version of the report, and the data collected in the background is convenient to enter in the system.
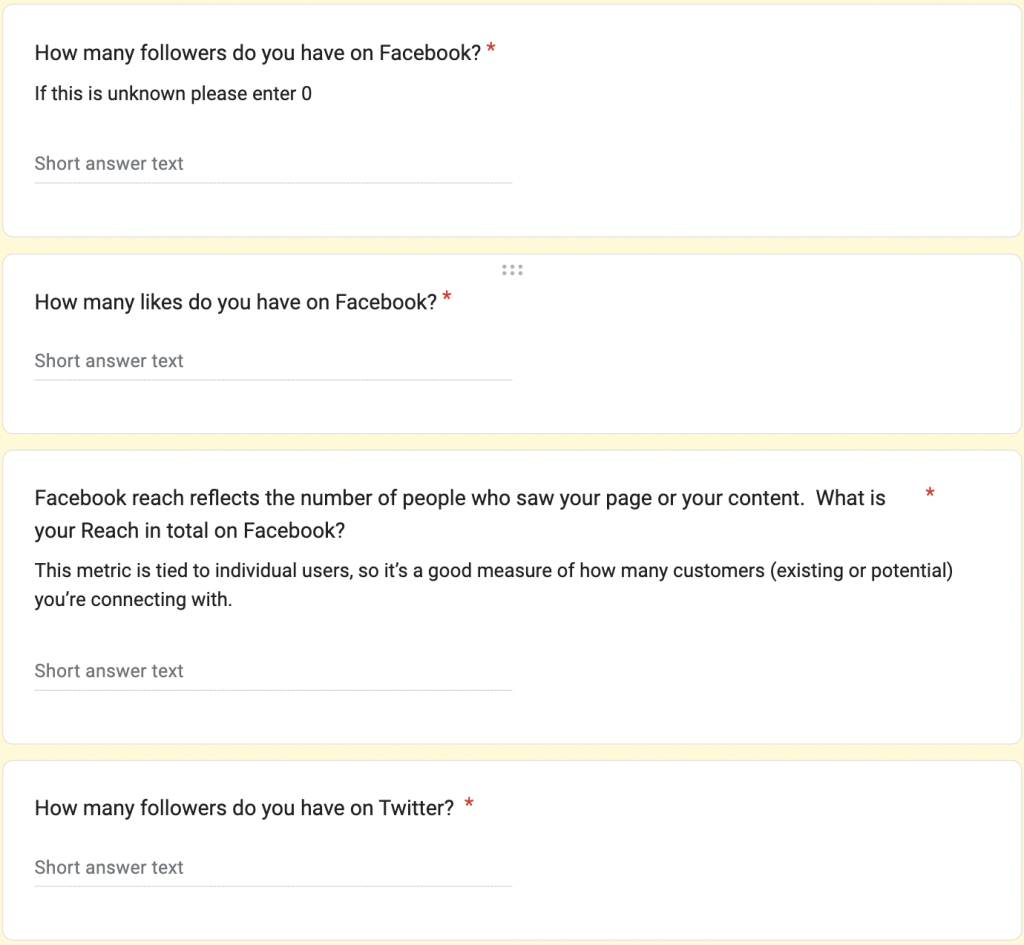
A screenshot of the new URL data collection form.
Where to next
By establishing a normalized data system we have built a system that allows URL to understand and utilize data from various angles. This sets a baseline of standard metrics that have been gathered and organized.
As we explore the unique relationships between BIPOC-run news organizations and their community, these conventional metrics of audience quantification can provide context to those unique relationships. As the project with URL Media progresses, this data will provide potential validation of our assessment of the value of metrics and present a complete quantitative picture of media and audience relationships.
In the future, our data and insights will be incorporated into BIPOC-run news organizations’ media kits, help identify what metrics can tell a compelling story, what the audience of BIPOC media look like, and where they are engaging.