
The data context toolkit provides questions and tips for journalists to provide more context on datasets.
Providing context for data in journalism
This month, for Innovation in Focus, we’ve created an accessible data context checklist that journalists can use to provide proper context when reporting on datasets. This checklist was created in partnership with KBIA reporter Sebastiȧn Martinez Valdivia.
One dataset we used for this work was the Missouri Healthnet Applications. Here are takeaways to assist you in making data points easier to understand for readers:
Provide background
When reporting on datasets, background and context on the dataset is crucial for the readers to have a proper understanding of what the set means and where the statistics are applicable.
Some questions that can help you provide background for the readers include:
How large is this dataset?
This question allows the reader to see how statistically sound. In order for a dataset to be statistically significant, you can use the following formula:
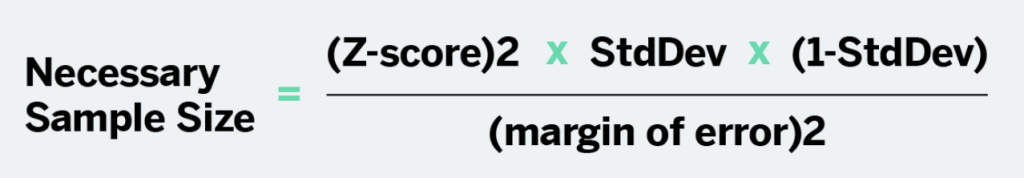
For example, if you wanted to collect a dataset that is representative of the population of Missouri, which is around 6 million, you could calculate the minimum sample size for a statistically significant dataset like this:
The z-score would be 1.96, if you assume a 95% confidence interval, which has a 5% margin of error. When calculating the sample size, assume that the standard deviation is .5.
For the state of Missouri, the formula would look like ((1.96)2 x .5(.5)) / (.05)2, which would mean that a statistically significant dataset would include 385 responses. Most datasets will have more responses and the more responses you have, the better the set tends to be.
When was this dataset collected?
When the dataset was collected is crucial for the reader to know. Data that was collected 10 years ago is no longer applicable to the present, but can be used to provide historical context or allow the reader to have a better idea of the subject area. Additionally, datasets can become less relevant to the present day in the wake of significant societal change. For example, after the COVID-19 pandemic began, some datasets collected before the pandemic began became less relevant.
Is the dataset consistent?
Many data sources change the way they report data, especially if the data is being collected over a long period of time or is a follow-up collection. Multiple times when I have been working with data, over time the dataset has started collecting more or less data, which can make analysis and visualization much more challenging. Sometimes, in this situation, it makes sense to segment the data by the differences for analysis and visualization, which is not ideal, but if the readers are aware of this, it can also provide more insight into the data and/or article.
What questions were asked?
The specific questions that were asked are incredibly important to the dataset. There are a myriad of ways that a question can be asked and how you specifically word that question can change the way that respondents answer. Making sure that the verbiage of your question is understood the same way by all your respondents is crucial. Additionally, making sure that the questions you ask are understood by your respondents in the same way you intended them is incredibly important.
In addition to knowing what questions were asked to collect the data, it’s also important to know more about how the questions were asked. For example, if the dataset is collected via a survey, you should be wary of common survey question pitfalls like these:
Leading question:
Wording of the question clearly suggests the desired response
Example: Keeping in mind that I grade your final, how am I doing as a teacher?
Loaded question:
Very emotionally laden language, intended to evoke emotional response
Example: On a scale of 1 to 10, how big of a jerk do you think he is?
Double barrel question:
A question with multiple parts that only allows you to give one answer
Example: Do you like horses, sheep and scorpions?
Double-binded question:
A damned if you do, damned if you don’t question where you have to incriminate yourself.
Example: Have you finally kicked your heroin habit?
Is there a control?
Confirming that there is a control, or a variable that is consistent throughout the dataset is key when finding trends and correlations in datasets. Data collection can be full of biases, which can lead to the data being “dirty” or having inaccuracies.
When interviewing Dr. Keren Landman for this series, she discussed how some journalists without a scientific background may not intuitively know to look for a control. When working with datasets and statistics, using the scientific method and understanding as much of the data as possible is key.
Link back to the dataset for transparency
One of the best ways for readers to have an excellent understanding of datasets used in reporting is to link back to the original dataset that is being analyzed in an article. In some cases, the dataset you are working with is not open source or able to be shared publicly, but in other cases, they are able to be publicly shared.
Linking back to the original dataset used allows readers to go back and do their own further investigation with the raw numbers if they want to see it. A reader’s investigation may be as simple as looking at the numbers most relevant to them, for example, or responses in their geographical location.
Demographic data is key
Providing your readers with demographic data is essential to giving good context to your readers. If a dataset is mostly collected from a single demographic group, it does not necessarily mean that the dataset cannot be used, but it does mean that the dataset collected will not be as representative of, if applicable at all, to demographic groups outside of who the dataset was collected on.
Use the accurate demographic terms
When creating surveys or collecting data, make sure that the demographic terms used for data segmenting are the terms that those demographic groups use themselves. Not only is this imperative so that the data is accurate, but it is especially key for minority demographics.
Finding the right terms for demographic can be incredibly challenging for those collecting data due terms that were once considered inappropriate now being commonplace and terms once considered commonplace now offensive. In order to use good demographic identifiers, read scholarship on identifiers and provide definitions of the identifiers you use in data collection.
Providing definitions alongside using current identifiers is one of the best ways to collect data, as it allows respondents to reply in an accurate way, as well as preserve the data as time goes on and identifiers inevitably change again.
Race and ethnicity
Race and ethnicity are incredibly necessary demographic data points for a variety of issues, including the racial wealth gap. Having the data on different races and ethnicities can allow for light to be shed on inequities, as well as be used to measure progress.
Key questions to ask when collecting racial and ethnicity data are “Are racial and ethnic groups divided into categories that people of that identity feel comfortable with/group themselves into?” and “Do demographic terms make sense and are consistent among groups?”. For example, some Pacific Islanders do not feel that grouping themselves into “Asians” is accurate.
A key reason demographic data is collected at all is to find connections and trends within those demographics. If people being grouped together have vastly different experiences, the data trends will be wildly accurate due to improper segmentation.
Gender and sex
Gender and sex are key demographics when collecting data, as the data can be useful information when addressing issues such as low percentages of gender marginalized people in fields such as engineering. However, many datasets have collected their information in outdated or inaccurate ways.
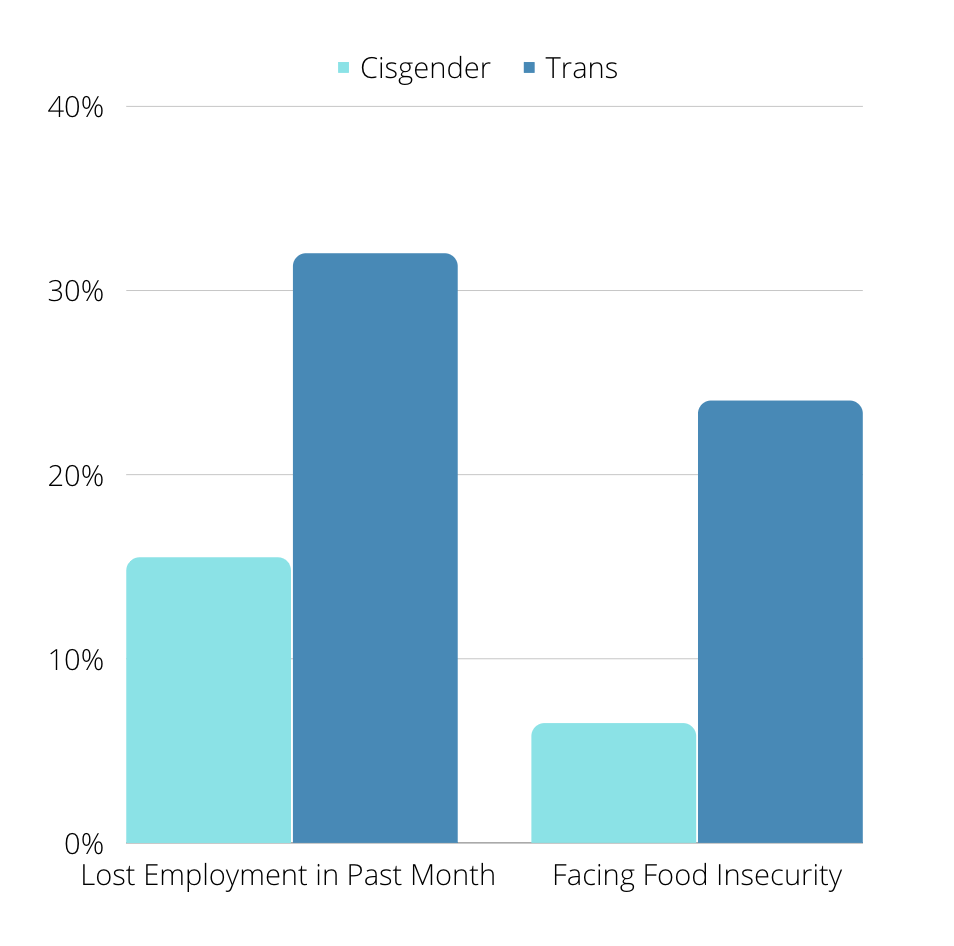
Asking the question “Does this dataset differentiate between gender and sex?” is imperative for context because without that distinction, issues specific to trans people may be ignored or believed to be nonexistent because the data does not exist.
Additionally, differentiating between sex and gender is important because one may be more relevant than the other, depending on the context of a dataset. For example, when finding demographic data on the who works certain jobs or lives in a certain area, gender may be a more applicable demographic than sex, whereas in medical data, sex may be more pertinent.
Another question to ask about datasets with gender or sex demographic data is “Does this dataset assume gender or sex is binary?” While sex has a considerably more prominent binary than gender does, there are many intersex people whose sex falls outside the binary of male/female. Making this distinction in datasets can be helpful because it allows for more information, empowering readers and deepening the data.
Providing gender identity options outside the binary is important in demographic data as the number of reported non-binary people increases. Datasets using demographics to highlight gender inequities need to provide options outside the binary in order to be fully accurate.
Sexual orientation
While sexual orientation is an incredibly important demographic to include in datasets, the U.S. Census Bureau only started collecting data on it in the 2020 census. The data collected revealed deep disparities between LGBTQ+ people and their cisgender and heterosexual peers. Similarly to gender and racial data, providing demographic data on sexual orientation can provide helpful insights on the disparities that exist and serve as a tool to measure progress.
An incredibly important question to ask when reporting on relationship data, whether that be divorce or domestic abuse statistics, is “Were only heterosexual couples surveyed?” The lack of historical data on LGBTQ+ people and couples makes providing context on datasets challenging. A key question when reporting on trends found in the LGBTQ+ demographic is “Is this a historical or recent trend?”, which oftentimes may not have an answer if the data from the past does not exist.
Additionally, demographic segmentation within the LGBTQ+ demographic may sometimes be helpful or even necessary in order to find the most accurate information. For example, statistics of everything from domestic violence to being “out” vary between bisexual people and their lesbian and gay peers. In some cases, segmenting by gender or race within the LGBTQ+ demographic may be more helpful and in other cases segmenting by monosexuality (gay and lesbian) and sexuality that is more fluid (bisexuality and/or pansexuality) may provide better insights.
Final thoughts
Providing context for datasets and statistics used in articles is crucial to allow readers to have an accurate understanding of the data and to be empowered with the information. Providing background on where and how long ago the dataset was collected can provide the reader more information on where the findings can be applied. Additionally, having information on how large the sample size was and who was surveyed can allow the users to understand how statistically significant the data is.
Being transparent about where the dataset is sourced and what specific questions were asked will allow readers to truly understand what information was collected and what the data means.
Additionally, doing due diligence to confirm the demographic data using the correct terms to refer to groups is imperative so that respondents are accurately selecting a demographic. No dataset is perfect, which is why providing context is essential.
This article was edited by Mikaela Rodenbaugh and Kat Duncan.