Tag: flourish

Free tools, big impact: RJI’s resources for election coverage
The Reynolds Journalism Institute has spent the last several years building a library of free, practical resources designed specifically for newsrooms.
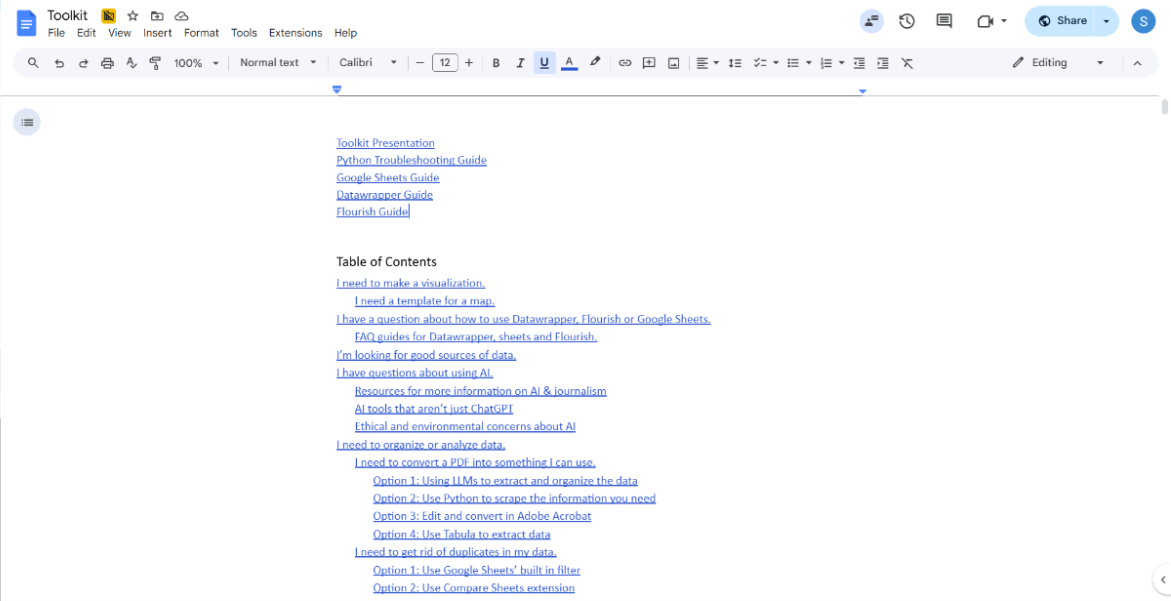
Training a newsroom on data visualizations
Creating an accessible, comprehensive guide to data viz for reporters at all skill levels.
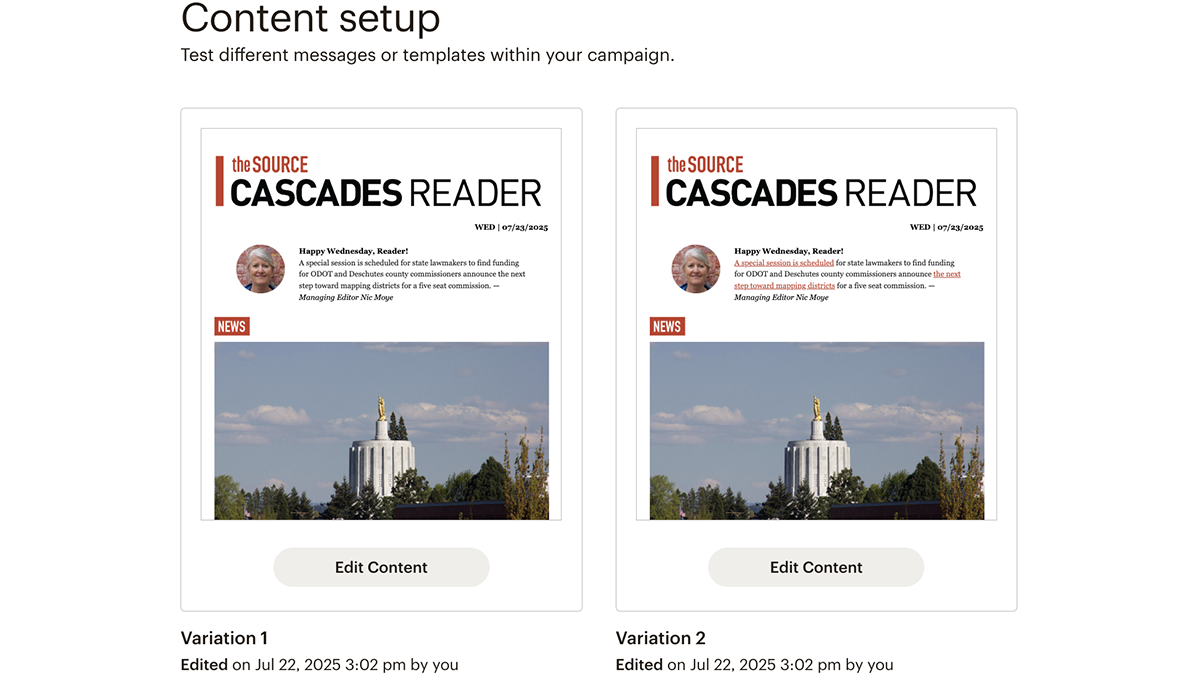
Newsletter A/B tests you can try — and how to set it up
Experimenting by adding links and generating AI summaries for newsletters.
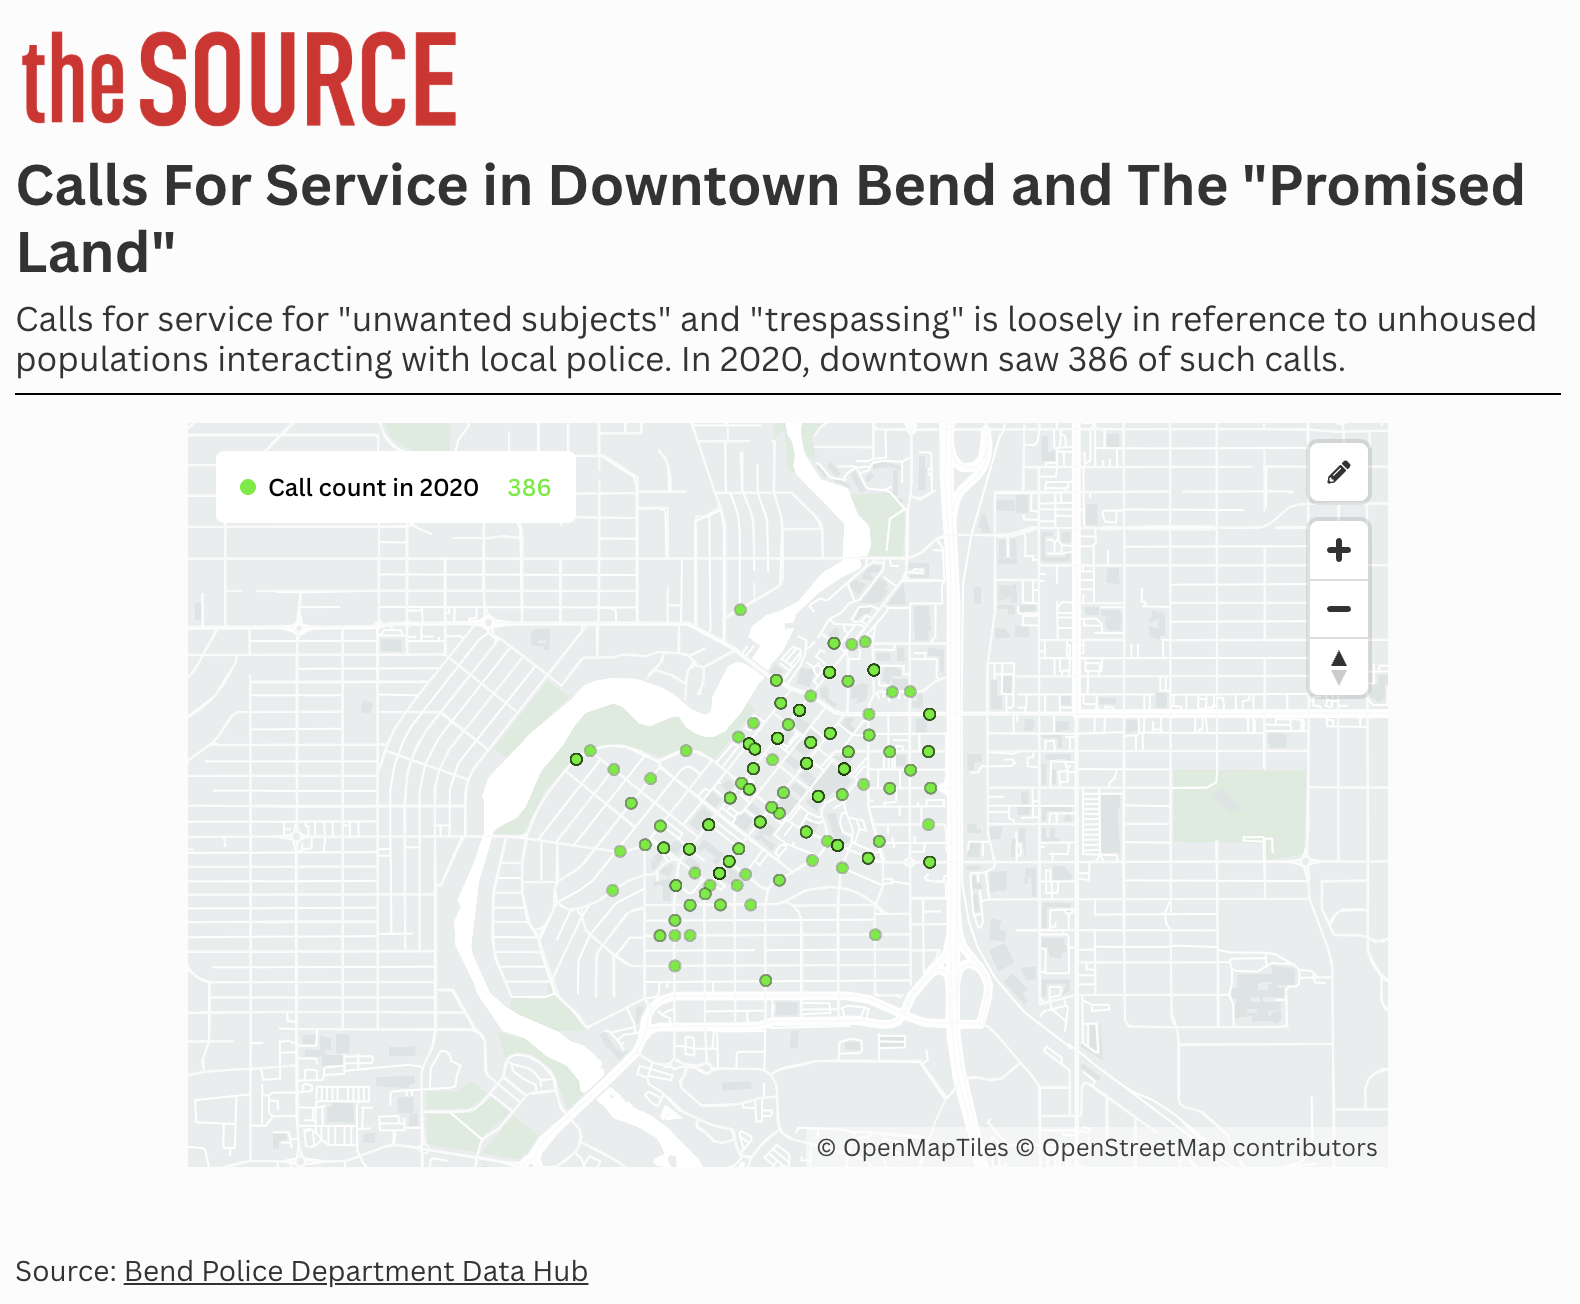
Fact checking police claims about crime with data maps
Identifying the influx of one local police department’s calls for service.
Integrating data visualization into a reporter’s workflow
Finding tools and methods that work for your newsroom.

Customization is key to a compelling sonification
Learn how to create your own story-driven sonification.
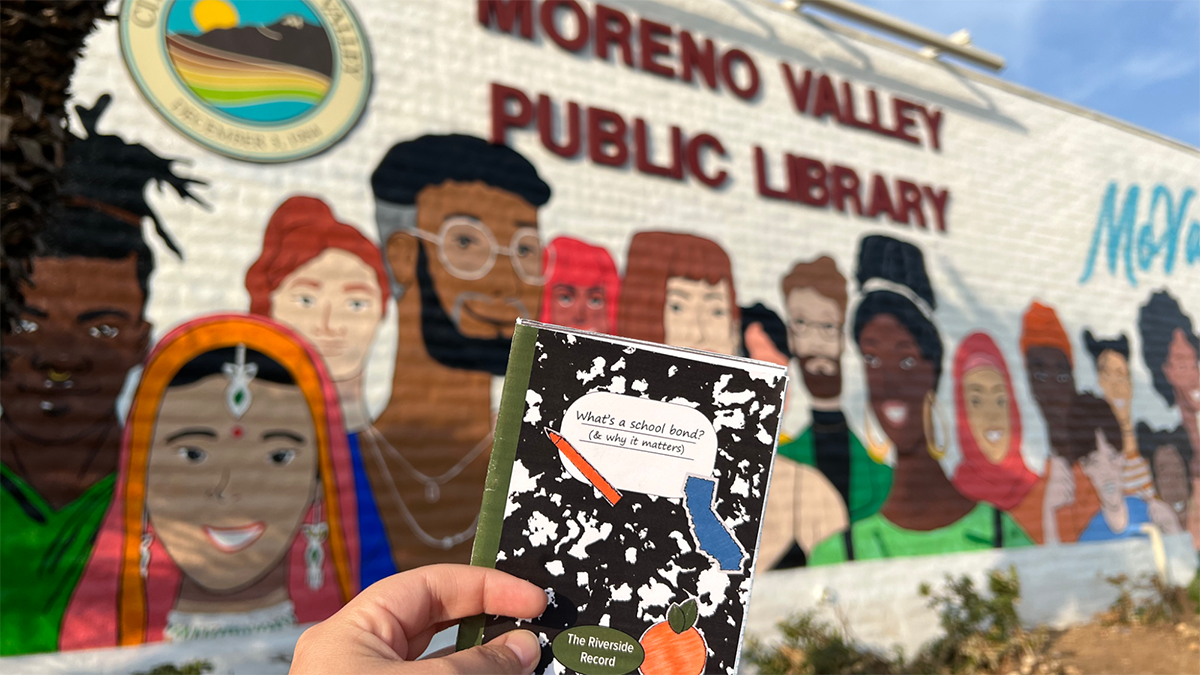
Using zines to share public service, civic information
From printing on a budget to distributing strategically: what you need to know.
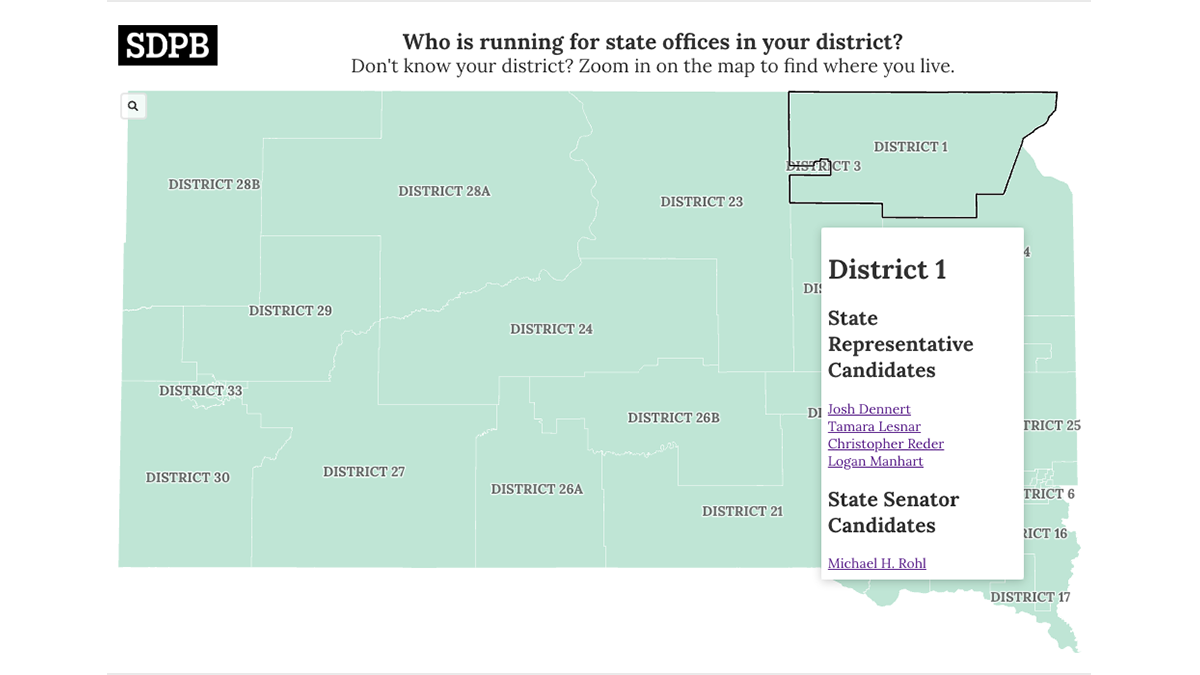
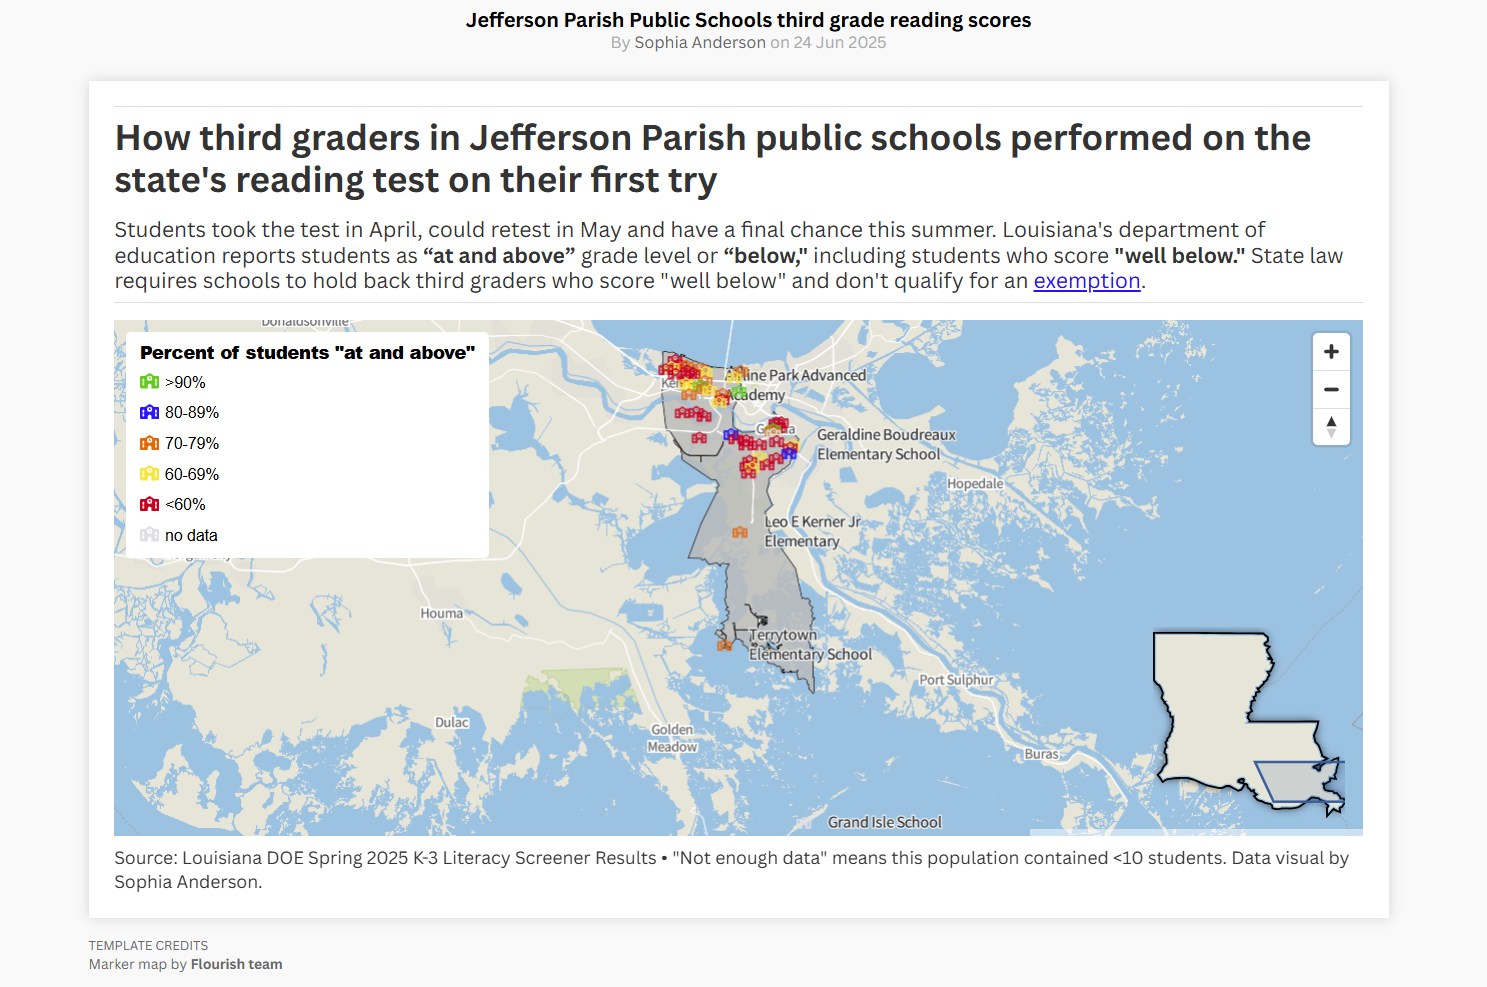
How we built a statewide election map
A simple, no-code solution to sharing voting information and four additional tools for your newsroom election projects.
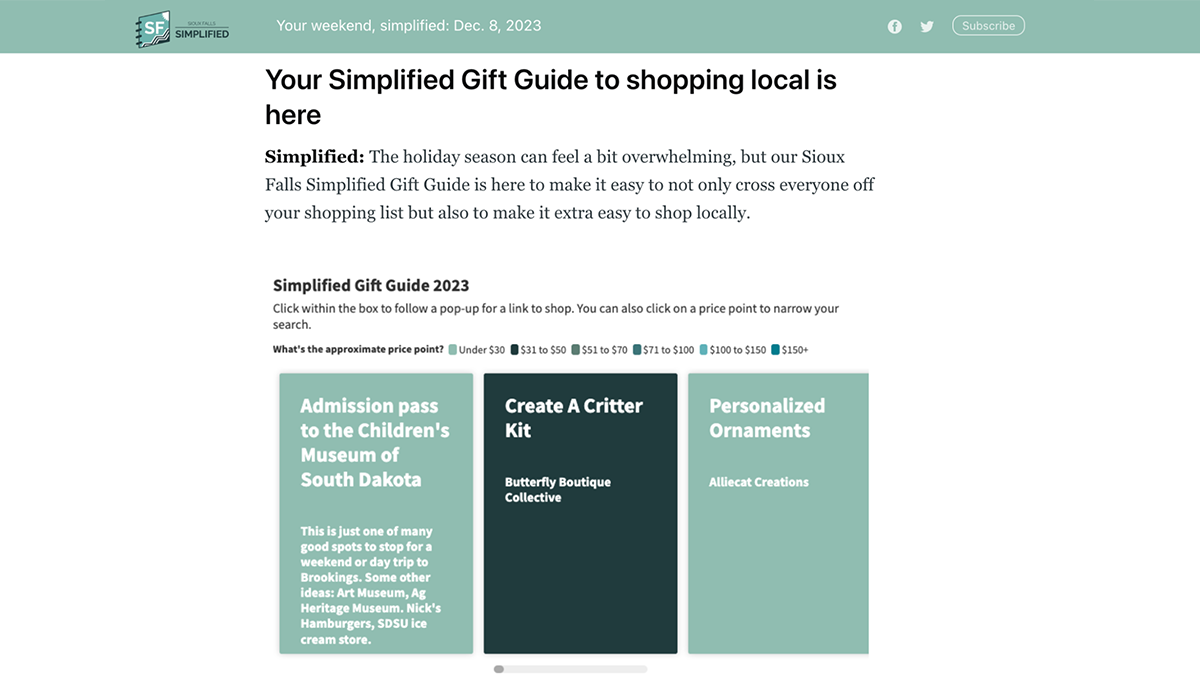
Building interactive visuals for newsletter engagement
How a newsletter drew participation through a holiday gift guide.

How to build news quizzes to encourage habitual engagement
Missouri Business Alert expands their quiz from Instagram to newsletters.