Tag: flourish
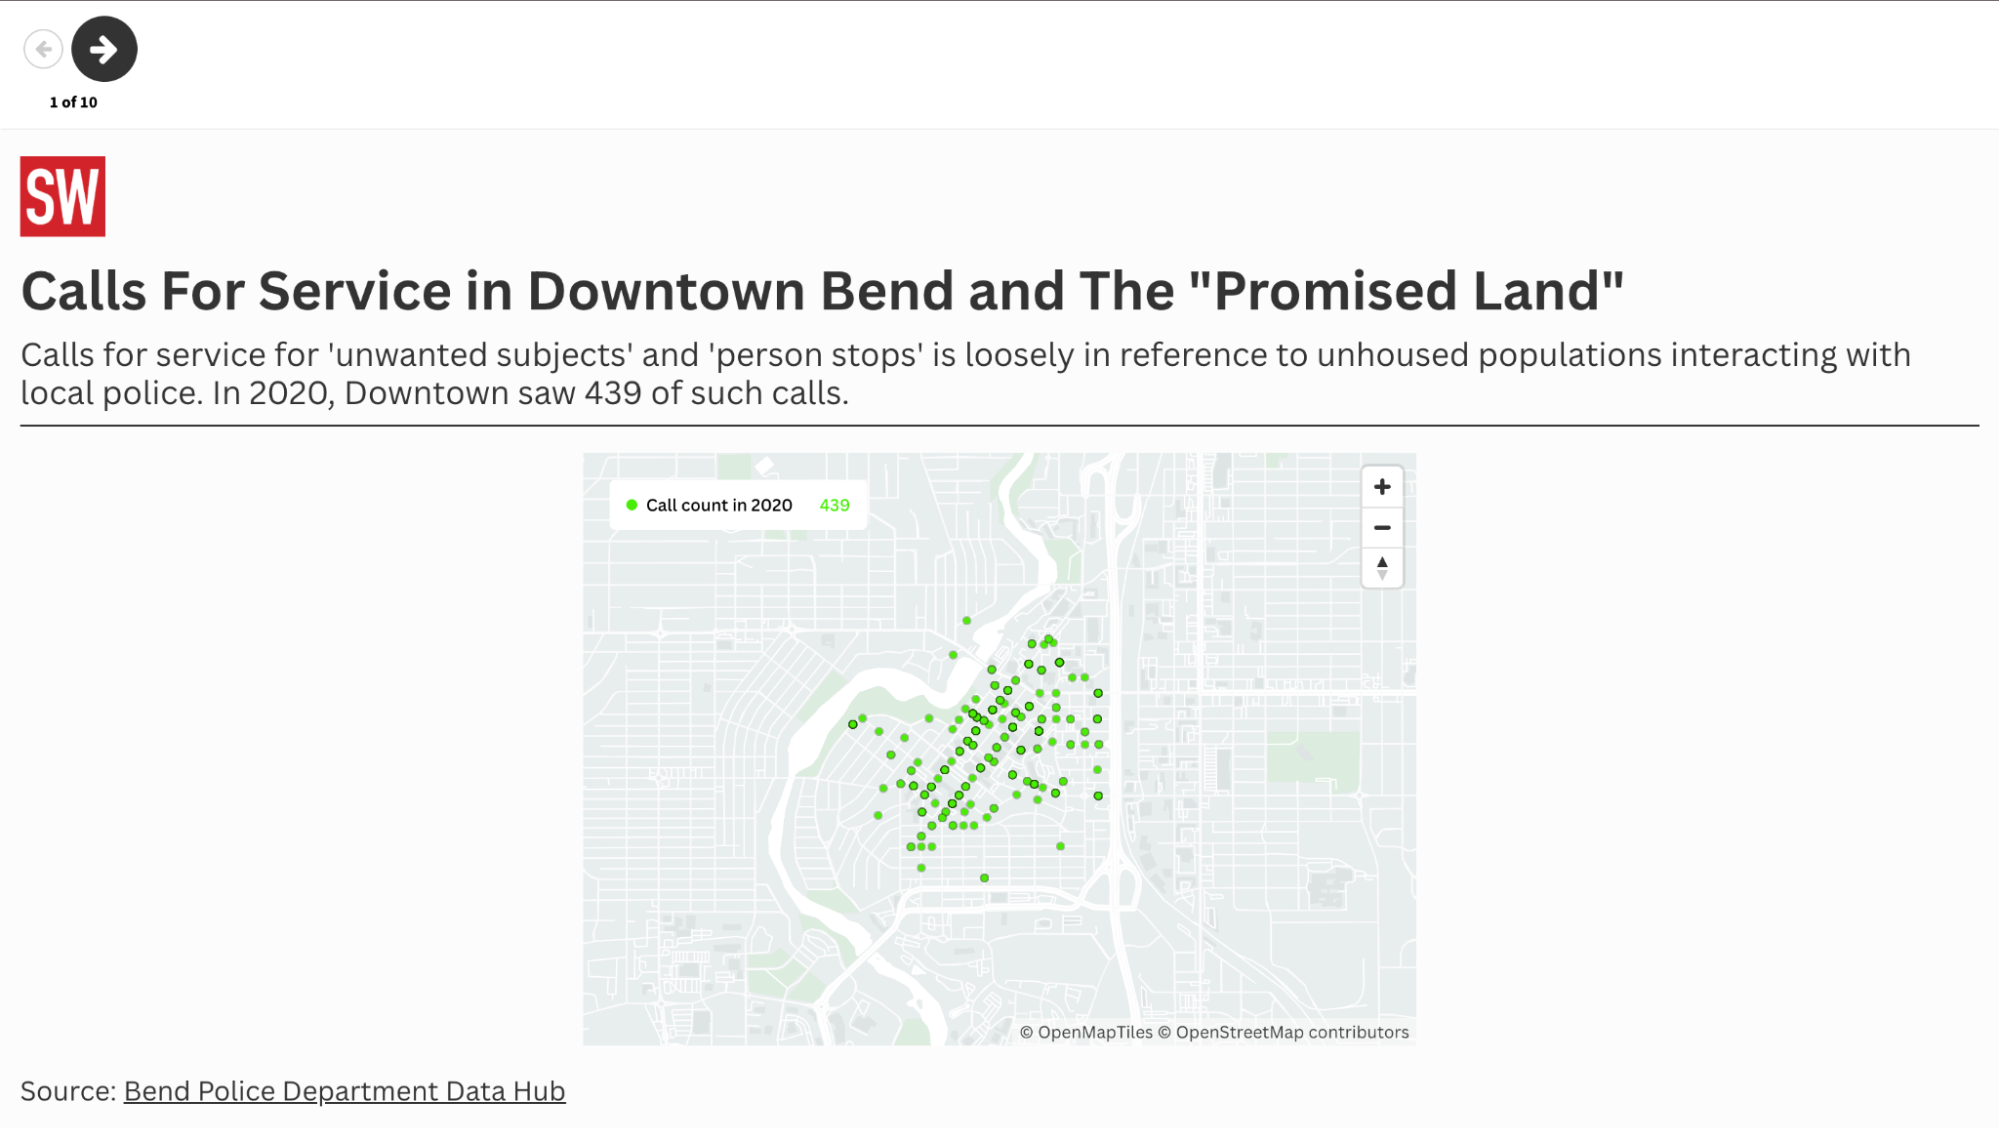
Fact checking police claims about crime with data maps
Identifying the influx of one local police department’s calls for service.
Integrating data visualization into a reporter’s workflow
Finding tools and methods that work for your newsroom.

Customization is key to a compelling sonification
Learn how to create your own story-driven sonification.
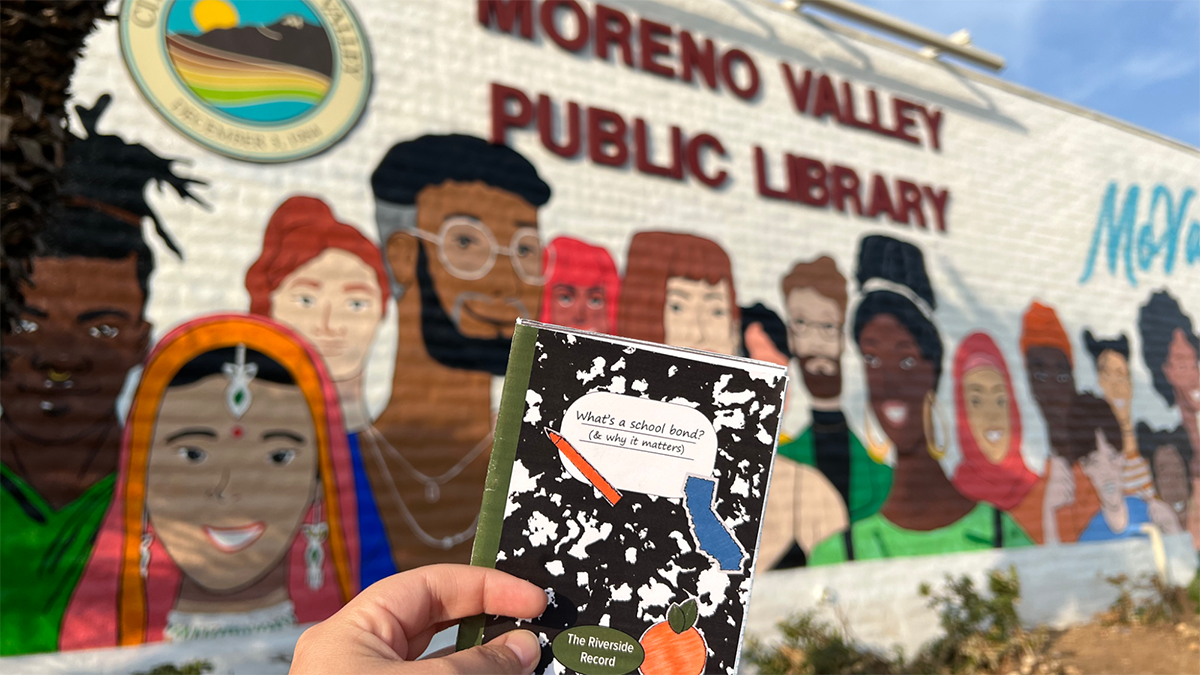
Using zines to share public service, civic information
From printing on a budget to distributing strategically: what you need to know.
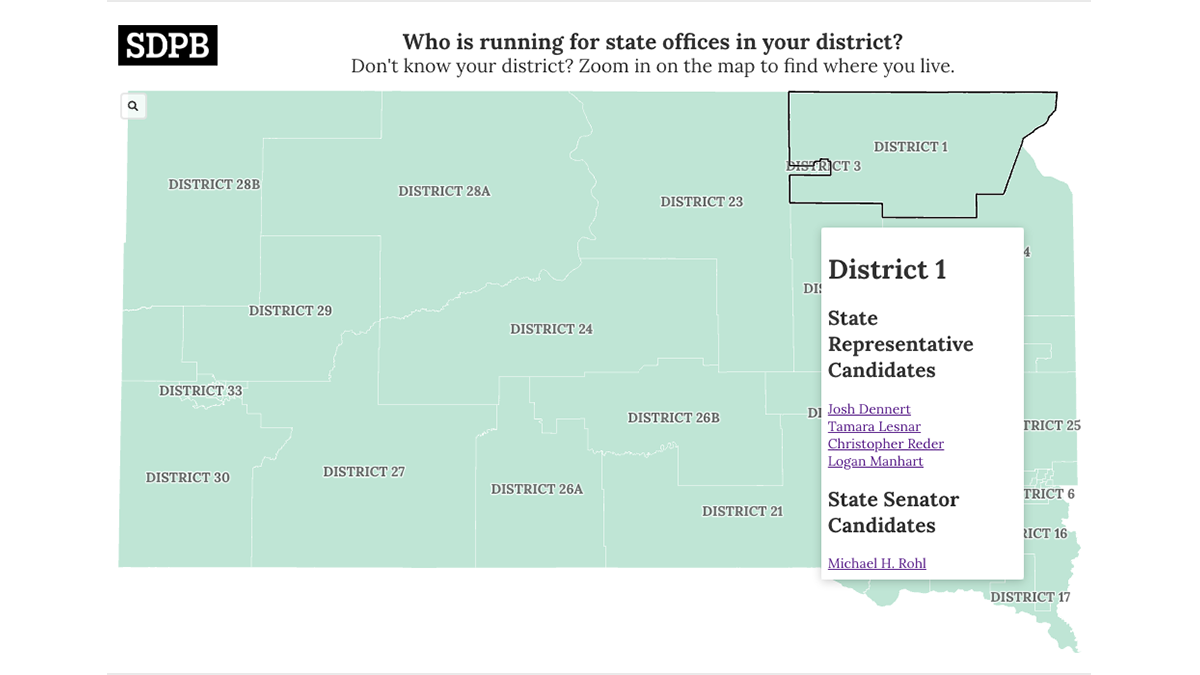
How we built a statewide election map
A simple, no-code solution to sharing voting information and four additional tools for your newsroom election projects.
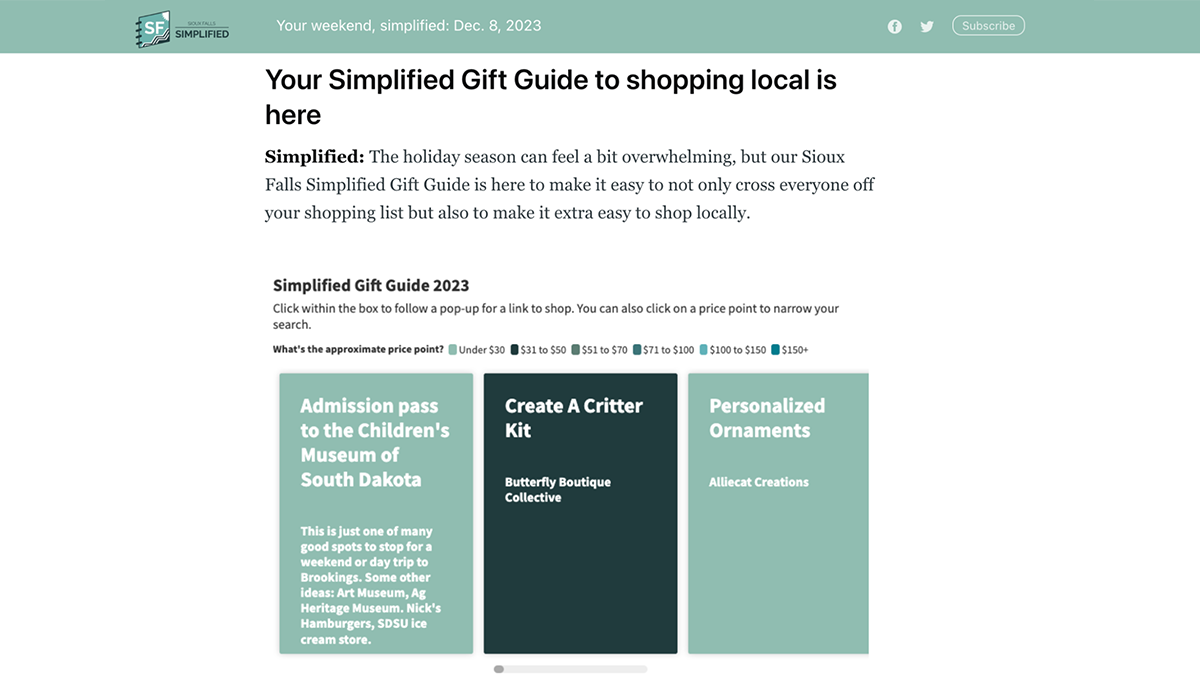
Building interactive visuals for newsletter engagement
How a newsletter drew participation through a holiday gift guide.

How to build news quizzes to encourage habitual engagement
Missouri Business Alert expands their quiz from Instagram to newsletters.
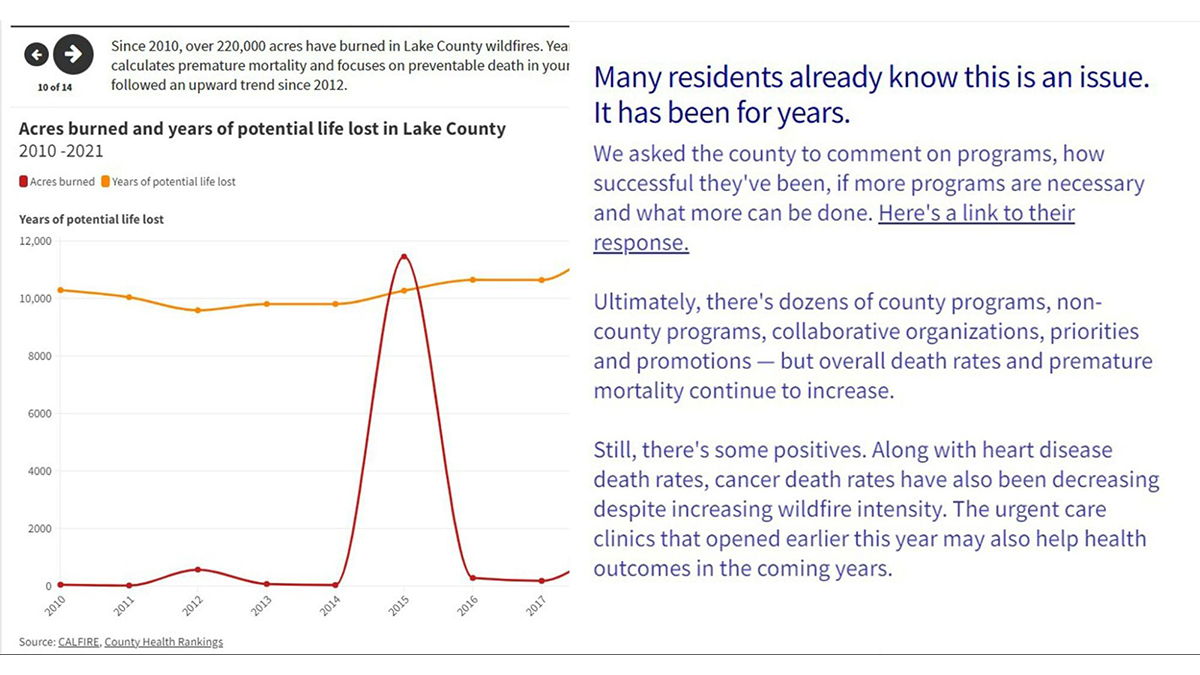
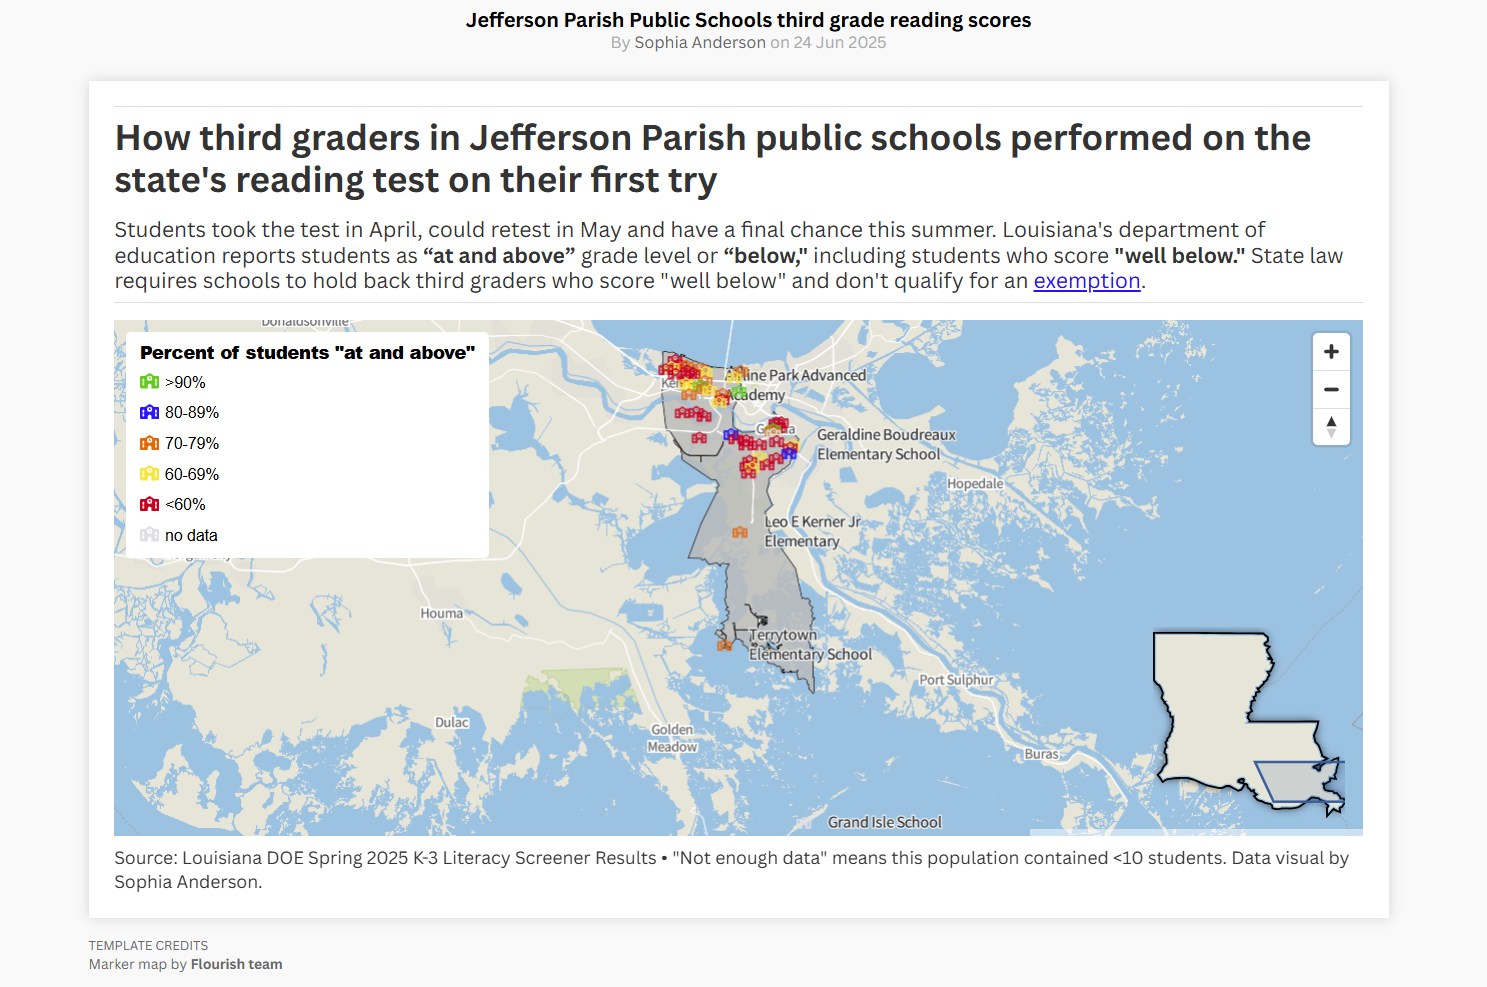
Using Flourish stories to build a visual data experience
How we crafted a complete package on changing health outcomes in Lake County, California.
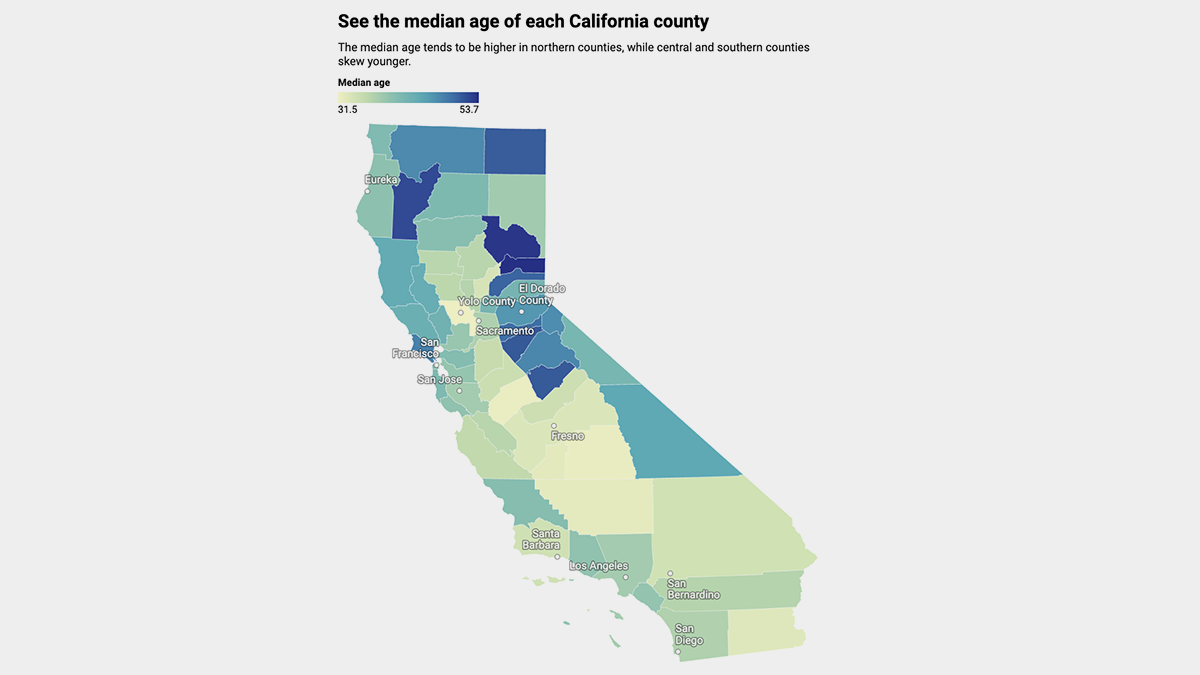
Making Census data accessible for reporters with varying data literacy
Your guide to variables, visualizations and more.
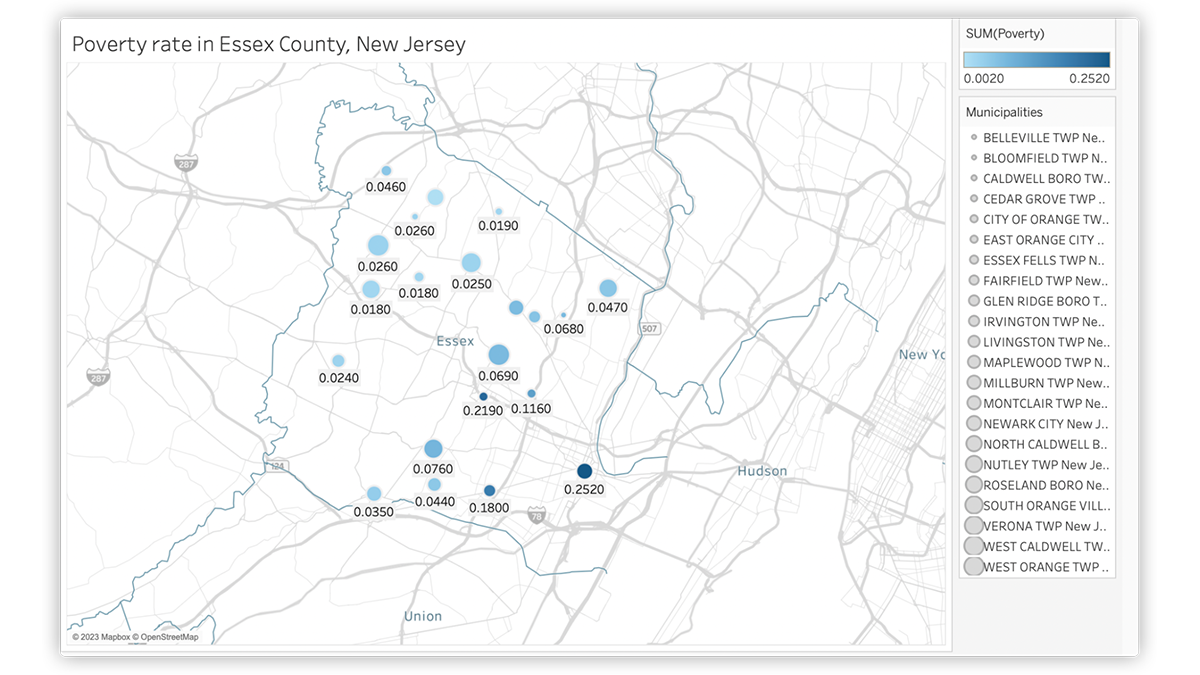
Building interactive maps to more equitably serve community
Bloomfield Info Project created community level maps to establish baseline tools to guide coverage decisions.