
Interactive elections coverage: Tips and tricks

Interactivity and efficiency can change how readers interact with politics
This month, for Innovation in Focus, we experimented by building an interactive school board elections guide for the Columbia Missourian. Here are my takeaways to help you create an interactive elections guide for your readers:
Efficiency is key
Many readers are incredibly busy, for these readers, efficiency is key. They want to understand the issues clearly and quickly. This is especially true leading up to an election where news outlets are covering multiple issues and the stances on them from each candidate, which can be lengthy.
When developing elections coverage, keeping coverage concise and relevant to voters’ everyday lives is crucial to keep readers present and engaged.
Interactivity at the core
Adding interactivity to elections coverage will not only increase engagement, as more people become more interested and interact with the content, but adding interactivity can also help readers to understand the information in various and different ways.
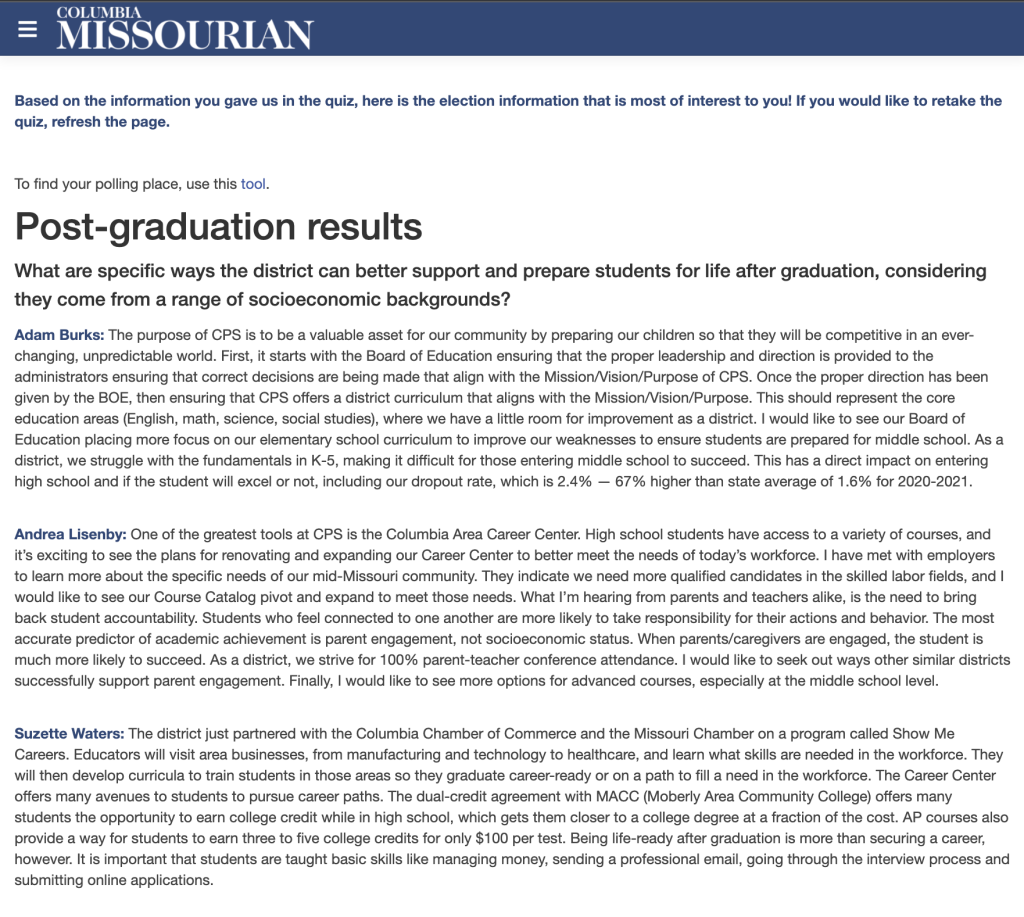
Including interactivity into elections coverage can be as simple as adding a quiz asking the reader what they are interested in or as complicated as an interactive data visualization on the facts behind each election issue. Other interactivity features include a quiz at the beginning of the article to customize their articles’ content, real-time reader polling, and graphics first reporting.
Promote civic engagement
I tried to keep civic engagement at the core of the design. When planning out the voting guide, including information on registering to vote and how to find your poll place were high priorities.
While elections coverage does not aim to sway readers in a particular direction on who or what to vote for, it can sway them to do one powerful thing: go to the polls.
Add useful tools for your readers
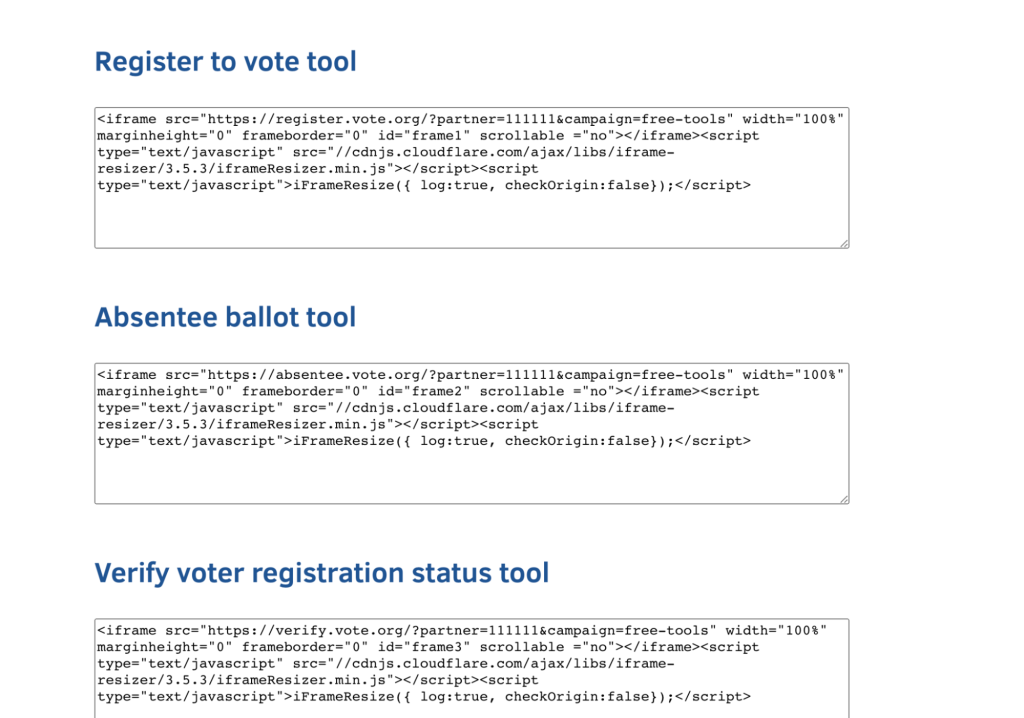
Increasing civil engagement can be incredibly challenging for journalists if not using the correct tools. Vote.org offers a variety of embeddable tools that promote civic engagement, including voter registration, voter registration confirmation, poll place locating, absentee ballot requests, and election reminders. By using the tools, journalists can try to increase their impact by giving readers the ability to register, find a poll place or request ballots right from their articles.
Make sure your design is equitable for all candidates
Placement of content is important in order for the coverage to remain fair. In the case of this guide, the order of candidates is alphabetical and there is a character limit for each candidate response so that the amount of information being presented from each candidate has an equal opportunity to reach voters.
Plan ahead for greater adaptability
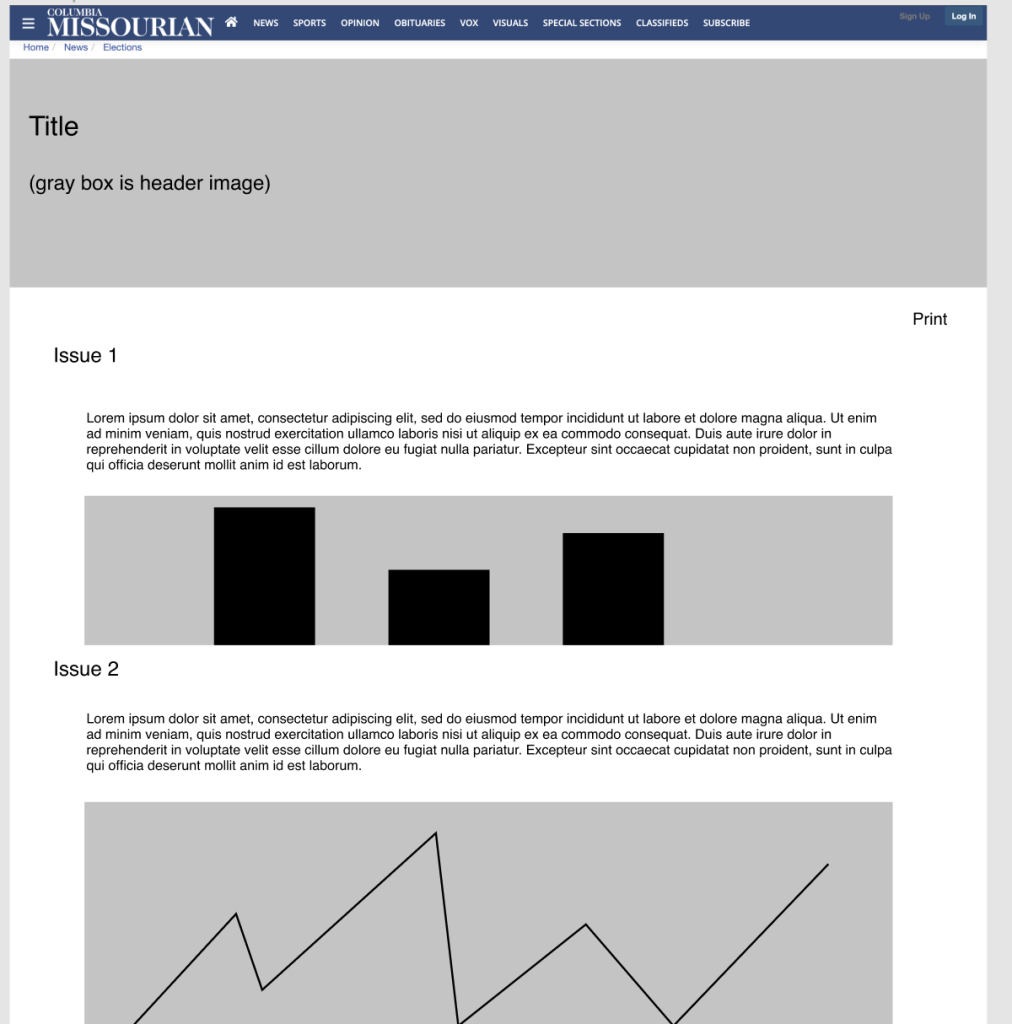
A low-fidelity prototype was created at the beginning to get a general idea of what the guide would look like.
During the ideation, creation, and editing processes, I definitely could have used more time in order to deal with challenges in the code for the guide, to gather more data for data visualizations, and to have the necessary time for impactful edits ahead of this particular election cycle.
However, this also created an opportunity to apply product thinking concepts into the process. This original mock-up included other features along with the interactive quiz and candidate responses, but for the minimum viable product some had to be removed.
For example, on the highlighting/note taking feature and a sample ballot I ran into issues with the code, and because I had not coded something similar before it ended up needing to be dropped. Similarly, when coverage priorities changed and The Missourian decided not to release public opinion polls for local issues, I adapted the initial idea by eliminating built in data visualizations.
In many cases, the editorial decision to drop features were made due to the impending deadline of the upcoming election, a challenge I am sure many other journalists and newsrooms can relate to. That is why I highly recommend advance planning and a longer timeframe as important priorities when creating an interactive guide for your readers.
Set yourself up for future iterations and improvements
Although having plenty of advance planning time is certainly helpful, if your newsroom is eyeing similar changes for a quickly approaching election cycle, you should not feel discouraged to start the process and produce what you can in the timeframe you have. The key is to be able to continually build off of previous efforts.
In the case of our experiment, this guide utilizes efficient, reusable code for the quiz, which could be reused by The Missourian’s journalists in the future to tailor a guide for the next election cycle to their reader’s specific needs. Additionally, the code from this article has little styling, but is organized well, which allows journalists using this code in the future to add aesthetic adjustments easily.
To build on the guide in the future, implementing features like highlighting/note-taking, data visualizations, and a sample ballot (each feature we initially planned but dropped) would be logical first steps. Other features that could be added on to improve the guide are a graphics first approach and improved accessibility, including more expensive subtitles for images and audio annotations for the article.
Editor’s Note: this article was edited by Will Lager and Mikaela Rodenbaugh.