![Digital collage by Aura [Auralee] Walmer, images from Public Domain](https://rjionline.org/wp-content/uploads/sites/2/2024/10/walmera24100201-1024x576.jpg "Digital collage by Aura [Auralee] Walmer, images from Public Domain")
Digital collage by Aura (Auralee) Walmer, images from Public Domain
Toolkit overview: Examples, tutorials, resources

Brainstorming the structure of the data sonification resource I’m building
As I get more responses from journalists, storytellers, and information designers about what will make a great sonification toolkit, I’m formulating the basic structure of this resource. My goal is to create a toolkit that demystifies the concept of data sonification, and provides clear, actionable avenues for implementing it.
With this aim in mind, I’ve created a content brainstorming page that lays out the high-level content of the toolkit. It is organized by chapters that the toolkit would contain (see the side panel), with descriptions of each section.
This brainstorming site is a way for me to get feedback about what you’d like the data sonification toolkit to include. Please take a look at this toolkit skeleton and send me your ideas!
Chapters
- Introduction / Start Here
- This section will provide a quick intro to the toolkit and explain how to use it.
- Terms & Concepts
- This section will provide some basic terms and concepts around data sonification. It will share some helpful context for potential methods and applications.
- Sonification Roadmap
- This section will provide a simplified roadmap of the sonification process, covering possible user considerations.
- These considerations might include: the rationale behind sonifying a data set, formatting data, selecting a method, planning the audio synthesis, and more. The Decibels Community also provides a guide that does this very well.
- This section will provide a simplified roadmap of the sonification process, covering possible user considerations.
- Example Archive
- This section would consist of a collection of journalism sonification projects. This will be a highly filterable table or database. It will include journalistic sonifications that appear in digital articles, radio shows, podcasts, and other publication formats.
- Tools
- This section would contain a list of available sonification tools, each categorized by ease-of-use, requirements, cost (if any) and method type.
- Resources (Docs, Guides, Tutorials)
- There is an abundance of documentation, tutorials, and resources that people in the story-conscious sonification community have built. This section would centralize the links to those resources so that they are easily accessible for users of the toolkit to find additional resources they might be interested in.
- Quick-Start Exercises
- This section could contain about 3-5 exercises, each showcasing a different sonification process. Each exercise would contain a brief step-by-step guide, covering a different topic, using a different data set and tool, and demonstrating how the output might be implemented or published.
- Community
- This section will be all about connecting with sonification communities and organizations that are currently active, such as the Decibels Community and ICAD.
- Sonification Interviews
- I have been interviewing journalists and sonification designers about their projects and experience. This section would share some of those interviews in mini-podcast form.
- Contact, Connect & Contribute
- This section would provide a way for you to contact me about anything regarding data sonification, and to suggest updates or changes to the toolkit.
An archive is needed, but in what form?
Journalists have told me that they want to explore more examples of published data sonification projects. What’s the best way to share the trove of unique, creative, and under-appreciated sonifications out there in the world of journalism?
The options:
- An external website that pulls from a database
- A sortable table embedded directly into the toolkit
- Airtable or Google Sheet solutions
- Something else? What do you think?
I want this archive to be supplemental to the incredible Data Sonification Archive, not to replace it. I am getting in touch with Sara Lenzi (co-creator of the Data Sonification Archive) to discuss how we can collaborate and support each other in these archiving efforts. In my previous article, Breaking down the barriers to data sonification, I address that I’d like to document a collection of examples that appear specifically in journalism (see section called “Art of archiving”). This includes sonifications found in digital articles, journalistic podcasts, radio programs, and audio-visual news projects. These applications constitute a scope expressly curated for journalists and data storytellers.
Web designers, I need your guidance!
I’d like to build a toolkit that is well-designed, accessible, easy-to-navigate, and aesthetically thoughtful. To accomplish this, I am seeking guidance from web designers, accessibility experts, and user experience connoisseurs. With this support, I hope to create a resource that is sustainably useful for folks in the realm of data storytelling.
If you have experience with web design or web accessibility and care to share your knowledge, please get in touch! My email is aurawalmer@gmail.com.
Example of the month
This month’s featured sonification is a piece from the KQED science podcast called “LISTEN: 1,200 Years of Earth’s Climate, Transformed into Sound.”
The episode features a sonification by Chris Chafe, director of Stanford University’s Center for Computer Research in Music and Acoustics, who composed the music based on data compiled by three UC Berkeley graduate students (Hal Gordon, Kate Pennington and Valeri Vasquez).
The sonification conveys average global temperature and the concentration of carbon dioxide in the atmosphere over the course of 1,200 years. A continuous tone representing global temperature rises in pitch, and plucking strings become more active as CO2 levels increase.
The podcast host helpfully explains the audio components as the sonification plays, and references milestones in history such as the signing of the Magna Carta, the death of Genghis Khan, and Nixon’s resignation, providing temporal context for the listener. For so much of the time frame, warming and cooling regulation stays relatively stable, but as we get closer to the present day, we hear the intense acceleration of change, particularly after 1900.
Hal Gordon points out the benefit of hearing the data instead of visualizing it: “In all climate data, you see it in this long chart with time that is way longer than human lifetime, so it’s impossible to really experience, but when you sonify it, you actually experience time in a way that you can’t when you look at the chart.” This podcast episode is an apt example of sonification storytelling, because its narrative format guides the listener and effectively captures the scope of the data.
Listen to the podcast episode here: LISTEN: 1,200 Years of Earth’s Climate, Transformed into Sound.
Listen to the standalone sonification from the KQED Science YouTube channel:
Tool of the month
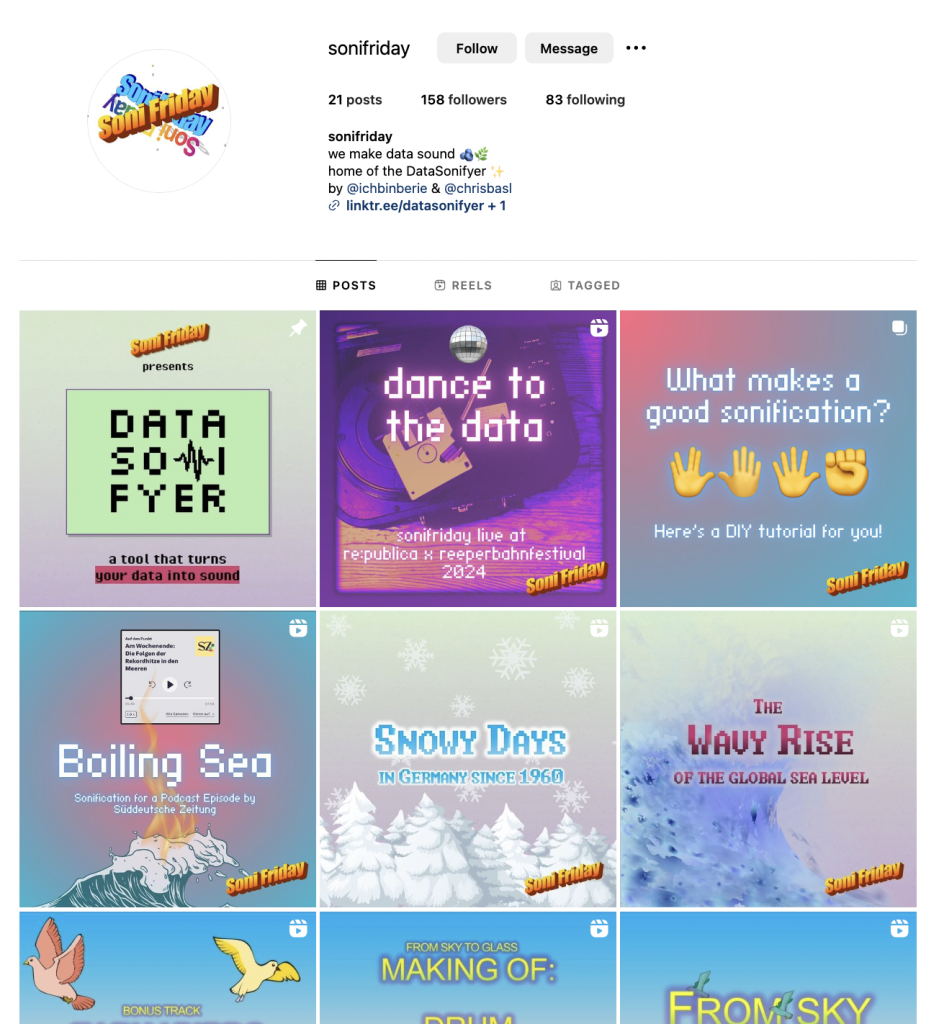
Berit Kruse (data journalist at SZ) and Christian Basl (editor and data journalist at WDR) are the dynamic duo behind SoniFriday, a project showcasing their ongoing sonification collaboration. It’s a wonderful collection of data + sound fusions, covering topics such as climate, gender, and ecology. It also includes brief tutorials about how to get started with data sonification. And since it’s on Instagram, these posts are easy to share on social media!
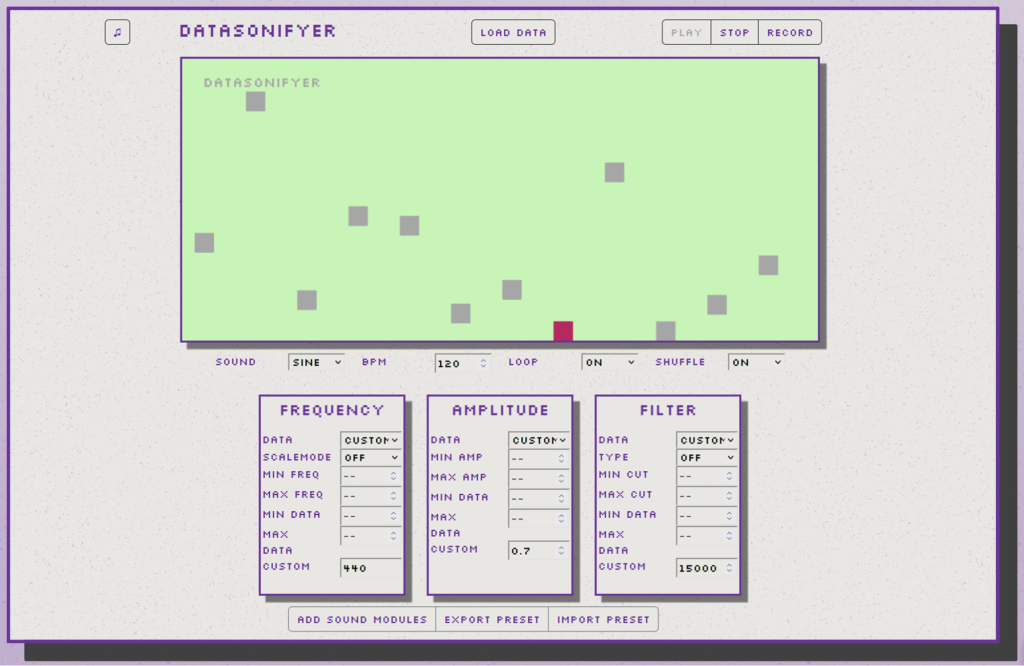
Berit and Christian’s collaboration led to the creation of a data sonification tool called DataSonifyer. It’s a free and easy-to-use sonification generator (custom-built by Christian) that allows the user to upload a data set and listen to those numerical values in the form of pitch, volume, note length, and/or tempo. It also includes a set of adjustable audio parameters, a thorough help section, and an audio export feature. Learn more at the DataSonifyer website (may require translation from German to English).
Launch the DataSonifyer Studio, upload your data, and give it a try!
Get in touch
As always, I’d love to chat with you about your ideas for this data sonification toolkit. A great way to contribute your thoughts is by filling out this quick google form: Your Thoughts on Data Sonification, Please 💭.
If you have any questions, thoughts, or knowledge you’d like to contribute, you can also email me at aurawalmer@gmail.com.
Cite this article
Walmer, Aura (2024, Oct. 3). Toolkit overview: examples, tutorials, resources. Reynolds Journalism Institute. Retrieved from: https://rjionline.org/news/toolkit-overview-examples-tutorials-resources/