
Photo: Eric Krull | Unsplash
Build a real-time dataviz bot (for free!)

When it’s not busy playing host to cryptocurrency scams, Twitter remains a widely adopted platform for the distribution of bite-sized information. For that reason alone, it’s well-suited to sharing real-time data—especially via charts and graphics.
Enter the world of visualization bots: automated tools that hunt down data, parse and visualize it, then post the resulting images to social media. Consider the BBC Election Bot, which visualized the results of the UK’s 2019 general election as it happened (and which inspired this post).
In this piece, I’ll lay out the five main steps it takes to assemble a visualization bot—all via open-source tools any newsroom can leverage for free. We won’t be covering the ins and outs of computer-science best practices; the priority here is getting a viable tool as quickly as possible.
1. Find the data
As a climate journalist, I might be interested in monitoring the global atmospheric concentration of carbon dioxide, that pesky gas that’s helping trap heat in our atmosphere. Global carbon dioxide data are maintained by the National Oceanic and Atmospheric Administration (NOAA), and their scientists post a new dataset every day summarizing the previous day’s measurements. That makes this monitoring task appropriate for a simple bot treatment, because the datasets always look the same, and they’re released in regular intervals.
Why go through the trouble of wrangling, visualizing, and tweeting out some data that NOAA already posts publicly? Part of the appeal of a visualization bot is that it’ll bring the data to your audience: They don’t have to navigate a federal website to uncover the insight we’re trying to convey. Besides, if they did, they’d be met with this image:
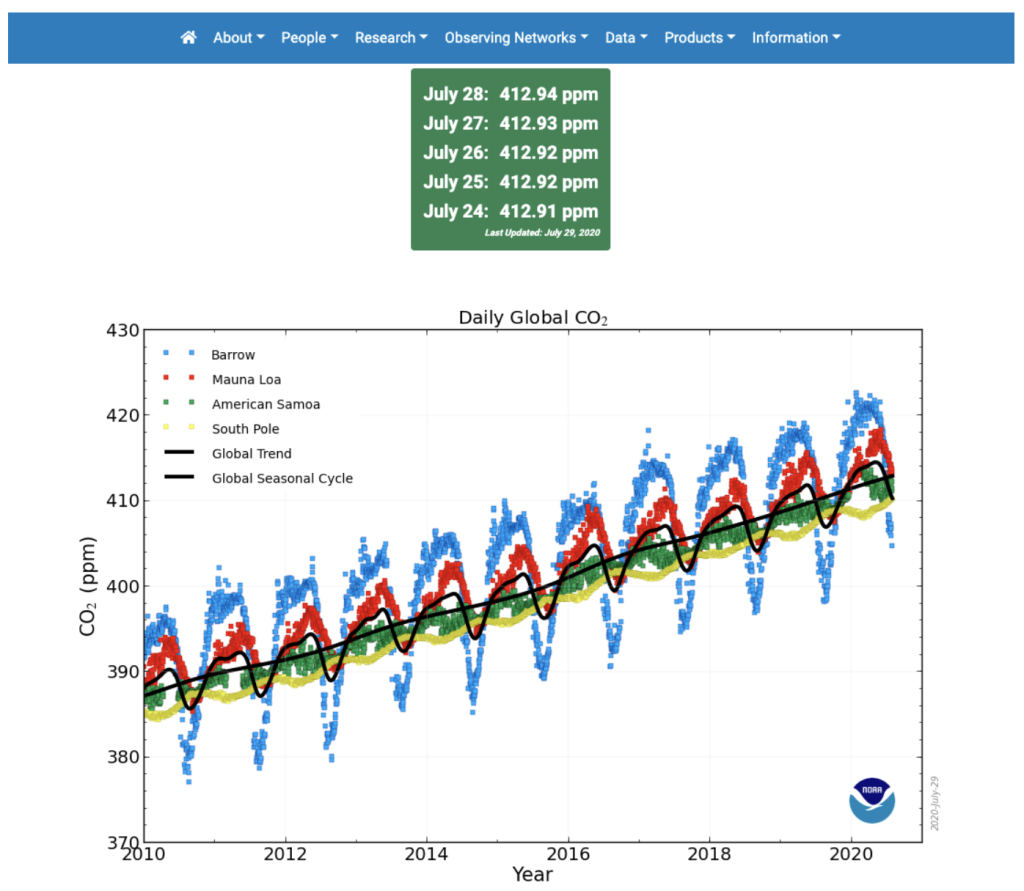
As visual journalists, we can probably do better than that. (No offense to NOAA! We’re on the same team here.)
With a bit of clicking around on the agency’s website, we’ll stumble upon the place where they store the underlying data. We can work with that!
2. Get and format the data
Throughout this exercise, we’ll use R, a programming language developed for statistical analysis. There are plenty of other ways to accomplish this wrangling task—including via a wide variety of other free languages like Python and JavaScript—but, well, I had to pick one. A full introduction to R is outside the scope of this post, and there are plenty of great resources out for learning the language. (I’m a fan of R for Data Science and An Introduction to Statistical Learning.) The point is: To build your Twitter bot, you’ll need a reliable manner of pulling the data from its source so you can manipulate and visualize it.
Using R, we can grab our data from the website with a single line of code:
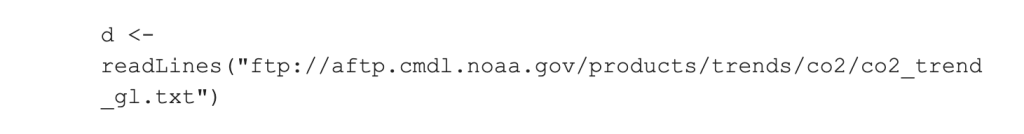
All we had to do there was throw the url of the dataset into R’s readLines function. And now that our dataset is stored in a variable, we can reformat it for visualization. In this case, we’ll just take a couple columns from the dataset and cut out everything but the last decade of datapoints. If you want to check out the code for doing so, you can follow along in a GitHub repository here.
3. Visualize the data
Now that we’ve nabbed and formatted our data, we’ll want to visualize it. I chose to leverage ggplot2, a set of R functions for data visualization. (The “gg” stands for the grammar of graphics, a set of rules for mapping data characteristics to the aesthetic characteristics of geometric objects—and ultimately combining layers to build a graphic.)
We’ll also take another page from the BBC by adding a house style for data visualization on top of these functions to make our charts publication-ready. If you’re working in R and want to customize your visualizations in a similar manner, the BBC has posted their custom styling code here. Update it to match your own visual brand! I’ll grab some custom fonts from Google Fonts and choose a color palette that doesn’t bother my sad, colorblind eyeballs.
Just as the data wrangling and transforming steps could have been accomplished with a variety of approaches, data visualization is a field awash with tools to get the job done. In a future post, we’ll think through some of the other available options. For now, we’ll stick with ggplot2 and produce the following chart:
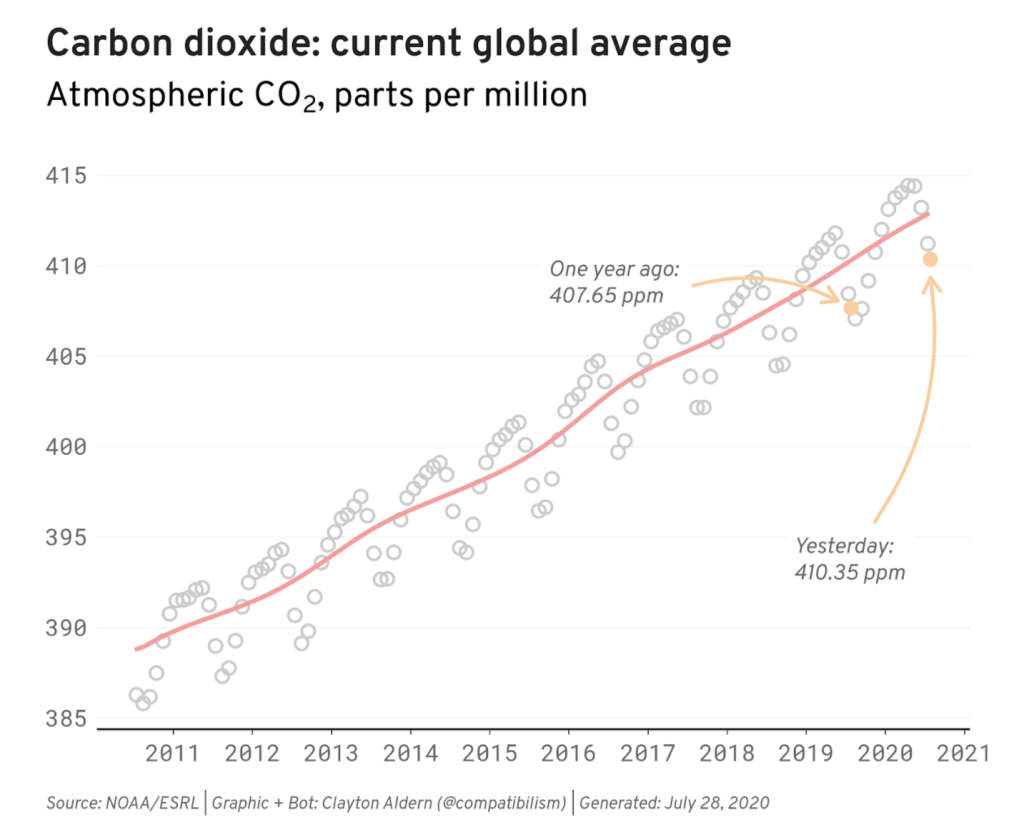
(Again, if you’d like to follow along with the code, I’ve posted it here.)
This chart is all well and good, but now we’ve got to convey it to the public.
4. Connect your bot to Twitter
With code that pulls data from the web, reformats it, and visualizes it to our preferences, we have a bot in hand that we’d like to share with the world. In order to do so, we’ll need to connect our script with Twitter. So, first things first: You’ll need a Twitter account. In particular, you’ll need a Twitter Developer account, which you can grab over at https://developer.twitter.com/. (Depending on the purpose of your bot, you might want to use your personal account, your institution’s account, or a new Twitter account wholly dedicated to your bot.)
Once you’re in, navigate to the Apps section and hit the big ol’ “Create an app” button. You’ll need to answer a handful of questions about your bot and the permissions it’ll need inside the Twitter ecosystem. In this case, all we need is the ability to send tweets (i.e. “read and write” permissions). Tell Twitter as much, fire off your application, mask up, and go outside for a while.
Once your application has been accepted, you’ll be handed the keys to the castle. In this case, they’re API keys, and they’ll allow you to access the Twitter account in question from your script. (They’re a secret, so store them as you would a password!) Since we’re working in R, we’ll use another set of R functions—the rtweet package—to store these credentials. Once we do so (via the instructions here), we’re ready to tweet.
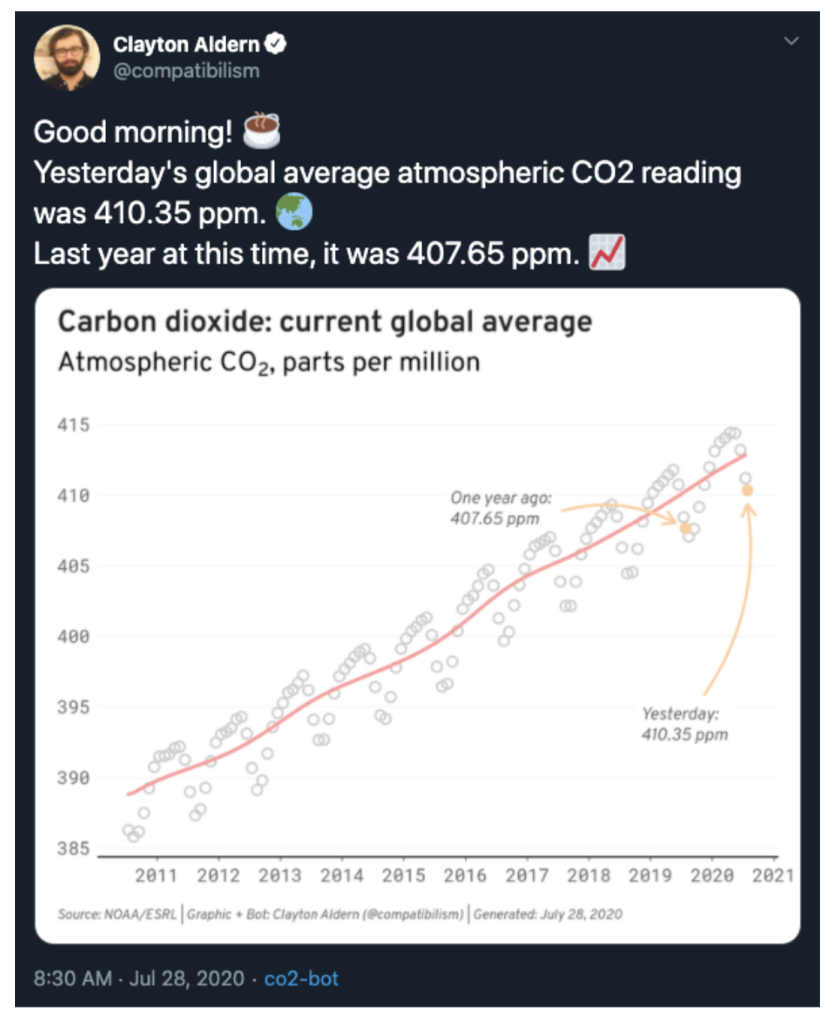
Using the same package we used to store the credentials, we can tack on some accompanying text and fire our chart off into the world using the post_tweet function. Success!
5. Host your bot
Now that the bot is in working order, we’re ready to publish it. It’d be nice if the bot ran every week, but it’d also be nice if we didn’t have to be at our personal computers every time we wanted the thing to tweet. To the cloud!
Since our bot is just a bunch of R code, we want a way of running R outside our computers—which is exactly what cloud computing is for. As with all things in life, there are plenty of options here; but for the purpose of this post, we’re going to run R via Amazon Web Services (specifically through their Elastic Compute Cloud service, or EC2). To set up an instance of R/RStudio in the cloud, you can follow these instructions. The benefit of the EC2 approach is that we can keep the cloud computer running 24/7—which is important if your bot is tweeting, say, every hour—and we’ll still be within the free tier limits of AWS.
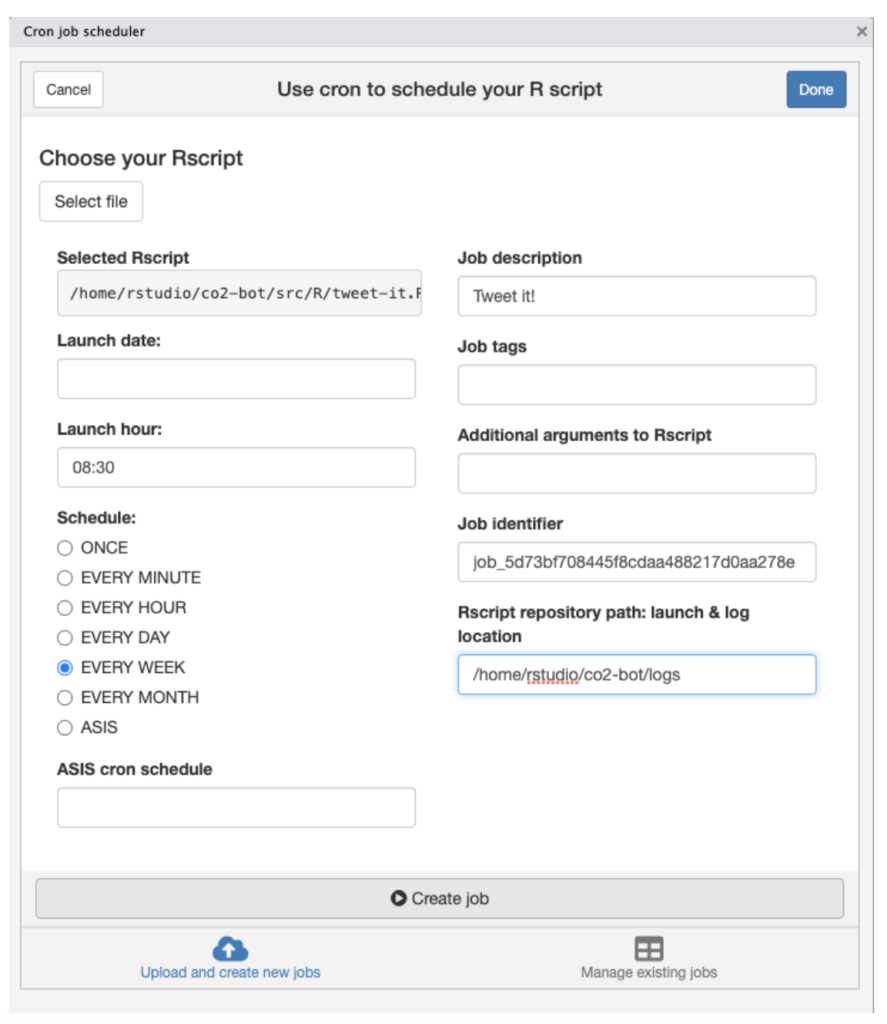
Once you’ve set up your cloud instance of R and added your files—in addition to storing your credentials in this new environment and reinstalling any custom fonts you want to use in your visualization—all that’s left to do is schedule your bot to run at regular intervals. The easiest way to accomplish this task is with the cronR package, which will allow you to specify the frequency of the calls to your script through this handy GUI:
(If you’re using something other than R, you can schedule a cron job using a different method. And that’s it! A free visualization bot. Naturally, there’s a whole lot we haven’t touched on here—including things like building a database, logging errors, and what to do when everything breaks—but we’ll dive deeper in future posts.
In the meantime, send me your bots!
You can get in touch with Clayton Aldern at caldern@grist.org on Twitter @compatibilism.