
You’re not alone

Connect with groups who are changing the soundscape of data-driven audio
Since data sonification is still an emerging field and is not yet widely applied in newsrooms, it’s easy to feel somewhat isolated while rambling along the sonifyer’s path. But wait, there’s hope! A thriving international data sonification community does exist, and there are several flourishing online spaces to connect with other sonification enthusiasts, ask questions, and share your work. These groups have been a great support to me as I experiment with data-driven audio for journalists.
Get started by checking out these communities, and see what strikes a chord:
- Decibels Community
- International Community for Auditory Display (ICAD)
- Georgia Tech Sonification Lab
- Highcharts Sonification Studio Community
- SoniFriday
- Sonification World Chat (SWC)
- Geo SonNet (Sonification Network for the Geosciences)
Sonfication inspiration
I crowdsourced sonification inspiration from folks in the community, so you can hear from them directly. I gave them the following prompts:
- What do you love about data sonification, and why?
- What is your favorite data sonification tool, resource, and/or workflow?
- Feel free to share a favorite sonification project of yours.
The replies were unique, wide-ranging, and inspirational! Below are some excerpts from these contributions.
“I have to say my favourite way to sonify things is by hand. It forces you to be slow and you start really understanding what you are sonifying.” – Jamie Perera
Hear more on what Jamie loves about data sonification in this interview, from the “If (Only) Data Could Talk…” Conference (2022) and Science Luxembourg.
Two sonification projects by Jamie: Anthropocene in C Major, and Life of Aeolus.
“I love the emotional connection that sound can evoke. It’s essential – especially in my practice – to create an emotional bond with the public when conveying data-driven messages, making them as relatable as possible.” – Tiziana Alocci
Find Tiziana on Instagram, and hear her sonification on Visa rejection rates.
“Odd as it sounds, I appreciate the imprecision… As a data viz person I’ve also learned time and time again that precision is only part of the equation – [projects] also need to be memorable, relatable, and relevant to people’s lives. Sound affects people in a unique way, and while you certainly can be precise in sonification, I find its strength to be in the experiential and emotional realm.” – Ben Dexter Cooley
Ben gave a live performance of an original sonification (in collaboration with Duncan Geere). Listen to the EP and read about it: The Carrington Event.
“I’m interested in turning my own personal data into something creative. I’m toying with calling it ‘personification’ as a way to try something different from the more usual use of general data, and to create meaningful music in a very personal way.” – Richard, of Decibels Community
Hear Richard’s sonification of personal data.
“I love data sonification because it challenges our assumptions about what we can do with data… By communicating data through sounds, we can encourage people to think about data in ways that engage creativity, social connections, emotions, and more.” – Jordan Wirfs-Brock
Jordan is a proponent of analog sonifications: “We often think that you need to have extensive coding skills and musical training to create a sonification, but that is simply not true: all you need is a curious mind.” Learn more about this approach by checking out Open Sonifications, a manifesto in collaboration with Duncan Geere and Jamie Perera.
Check out Jordan’s narrative sonifcation pieces as well.
“I like the fact that sonification has a connection to the world beyond music. It has the capacity to carry meaning from its source and bring it to other people/places, from scientific to aesthetic… My main tool for processing sonification data is Mathematica. I usually map the data to timing, pitch and loudness parameters, and output the results as MIDI files.” – Guy Birkin
“Data sonifications reveal the emotional layer behind statistics and datasets that get lost by converting observations from our world into numbers… We mainly use Sonic Pi to map datasets to different sound parameters, such as pitch, amplitude, panning, cutoff-rates of filters, rhythm and so on.” – SoniFriday
SoniFriday’s reasons for why SonicPi is a great tool:
- It has built-in sounds that are ready to use.
- You can create your own synthesizers using SuperCollider.
- You can control DAWs like Ableton (the data controls the DAW).
Listen to SoniFriday’s sonification of rising ocean temperatures.
“Data Sonification allows me to translate different aspects of life and play. It allows me to do this in a way that isn’t always seen and gives me a new canvas to merge ideas, concepts and equations for ears to listen to.” – Kofi Oduro
Kofi’s sonification of heart activity from personal workout data.
“I love the way that it helps people to feel things about data. The dominant style of visualisation is to strip back anything remotely emotive from a dataset and have it supposedly ‘speak for itself.’ That’s a fool’s errand – any dataset inherits the biases and feelings of the people who brought it into the world. Sonification doesn’t allow for this fiction – and as a result it’s a powerful and effective tool for data storytelling.” – Duncan Geere
In case you missed the link above, be sure to check out Open Sonifications – “partly a method for doing sonification work without a computer, and partly a manifesto for thinking about data and sound in new ways.”
Listen to On Standby (overnight!), a 10-hour sonification work about energy consumption designed to be heard while sleeping.
“Sonification adds a visceral impact to the data which is hard to explain – it allows you to feel the trends in a way not possible with the visual chart. I’m also very interested in the sheer utility of sonification in opening up our data work to entirely new audiences, like people who are blind or vision-impaired, and people who predominantly use video-based social media to get their news.” – Nick Evershed
Nick is the developer of Noisycharts, a sonification tool being used by The Guardian Australia. Find examples in this article about Australia’s inflation rate.
“I have a different approach to sonification… My tool, Chart2Music, is intended for blind people. The great thing about sonification is that it can convey a large quantity of information very quickly – not as fast as visuals, but faster than listening to a screen reader read out every single data point. The tool is being used by blind students, researchers, and professionals to work with data alongside sighted peers in a way that experts 10 years ago didn’t think would ever be possible.” – Julianna Langston
Check out Chart2Music, a JavaScript package that can be used with any charting library.
“Data sonification is a chance for me to credibly make music, but also to see the deep connections between music, math, time, and data visualization. I’ve been pleasantly surprised to find that the knowledge I have from non-musical fields have helped me understand music and musical theory better… I like the challenge of working with the constraints, like a haiku.” – Michael Corey
Listen to the music of seismic activity in Oklahoma, a sonification from Michael Corey and the team at Reveal.
Example of the month
This month’s featured sonification example is an audiovisual representation of the stock market in 2013, called “Market Music: Listen to how the S&P 500 performed throughout 2013.” In the form of a catchy song, daily closing numbers of the S&P 500 are communicated with a pitch mapping, and chords underneath the melody represent whether days ended in a market gain or a loss.
The song takes on a reggae-like rhythm, with guitar and piano chords landing on the upbeats. A drum track makes the sonification feel like a complete song, and there is also a human voice singing the names of months as they pass, providing temporal context. As the sonification progresses, the listener is able to hear the gradual increase in pitch of the melody, absorbing the message of a record year for the S&P 500.
This project also has a strong visual animation component, with a rotating data visualization to accompany each trading day over time, as well as useful annotations that appear during certain notable moments.
Tool of the month
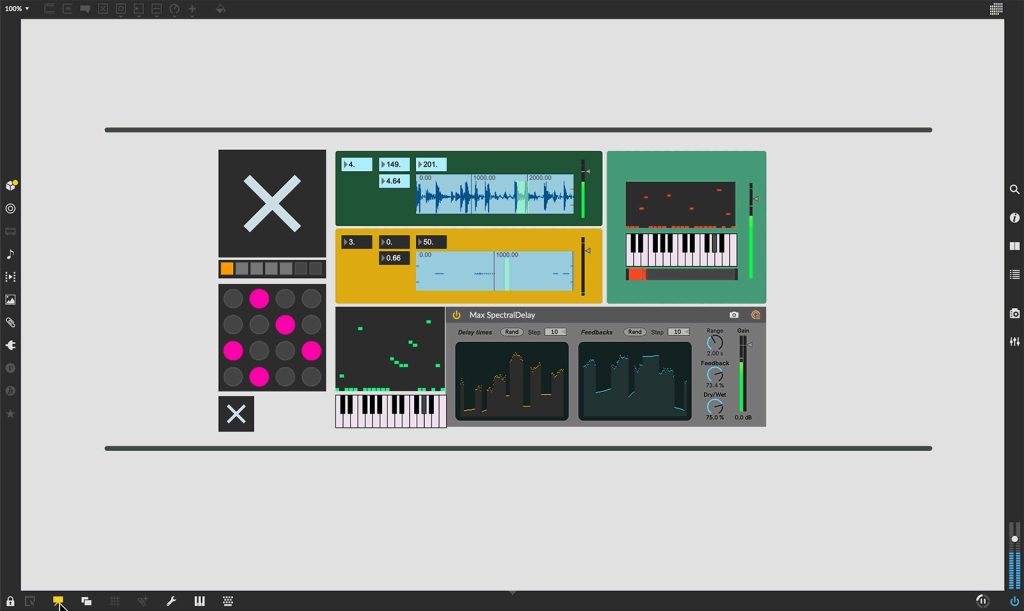
This month’s featured sonification tool is Max (aka Max/MSP), an interactive audiovisual programming tool developed by software company Cycling ‘74. Max allows users to start with a blank canvas, and build custom sound experiences by connecting “objects” together with patch cords.
Reflecting the analog world of patch cables and modular effects, it simulates the act of setting up a chain of audio processing hardware to create a sonic outcome. It allows for complex audio processing without needing to write code, since users arrange modules visually in the interface.
Max also allows users to manipulate their networks with a MIDI controller to perform or record custom sounds and audio samples.
Here are some resources for getting started with Max:
- Max Tutorials (Max documentation)
- Sonification with Max: Turning Data into Sound ($19 online course)
Cite this article
Walmer, Aura (2025, Feb. 19). You’re not alone. Reynolds Journalism Institute. Retrieved from: https://rjionline.org/news/youre-not-alone/