Tag: Tableau
Lean into what your core audiences value
A conversation with Jacqué Palmer, The Boston Globe on growing your newsletter.
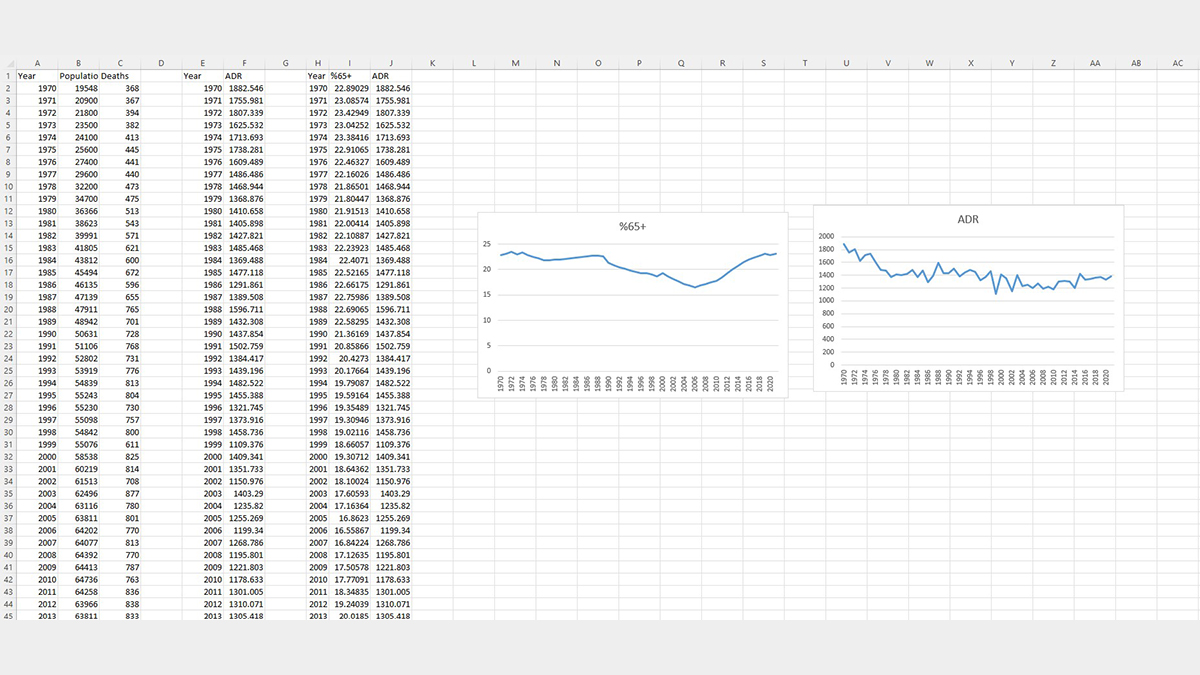
Going beyond local data to contextualize a community issue
Tools and advice for finding and analyzing data in rural Lake County, California.
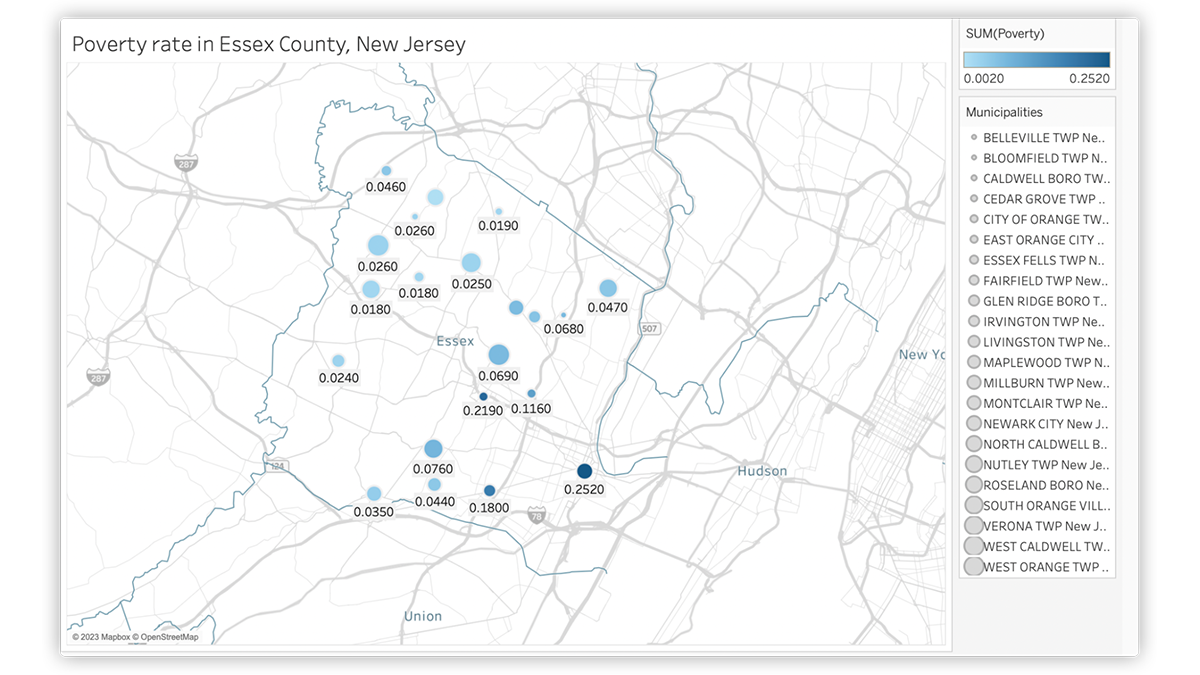
Building interactive maps to more equitably serve community
Bloomfield Info Project created community level maps to establish baseline tools to guide coverage decisions.

The people behind the data points
Weihua Li of the Marshall Project balances the severity and humanity of incarceration through data.
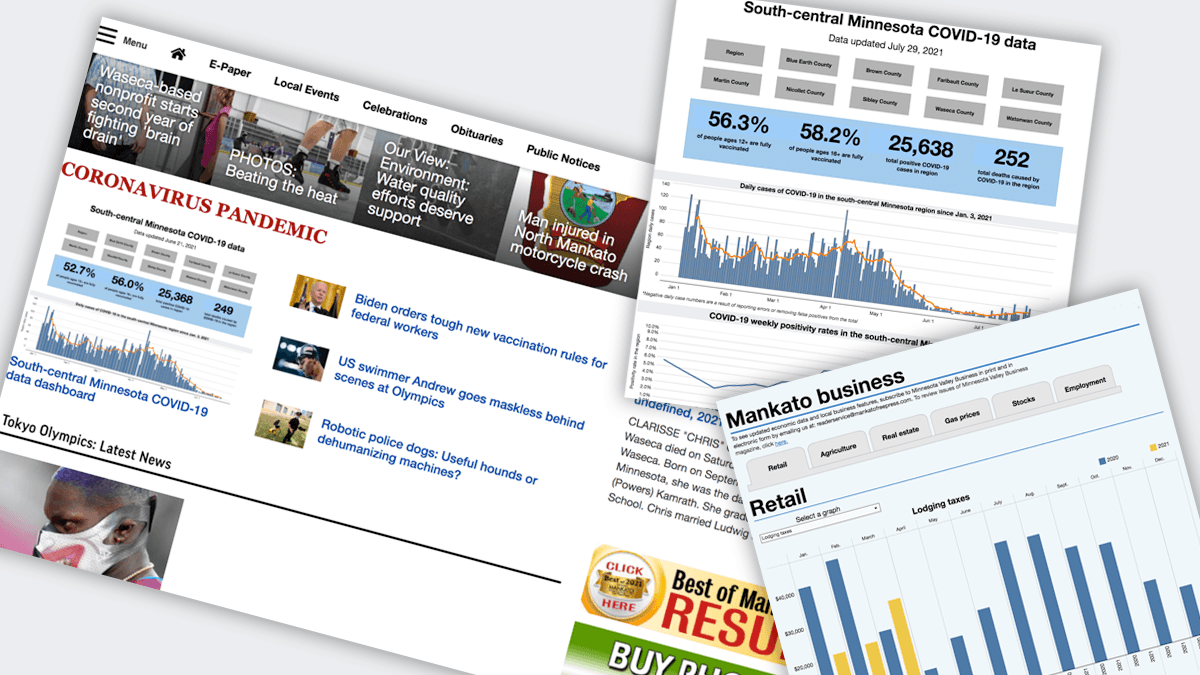
Maintaining digital projects in your newsroom
Create a Tableau dashboard that anyone can update with Google Sheets I had a busy summer working with and creating interactive digital tools for the Mankato Free Press. My work ranged from daily graphics to bigger long-term digital tools. I branched out from my comfort zone, using tools like Tableau and Flourish in ways I … Continued
Building simple data pipelines
Optimizing content limits on a user-by-user basis.

Pre-reporting for data journalists
A brief intro to exploratory analysis In a recent paper, a pair of statisticians took a stab at outlining “the most important statistical ideas of the past 50 years.” Among them: “counterfactual causal inference, bootstrapping and simulation-based inference, overparameterized models and regularization, multilevel models, generic computation algorithms, adaptive decision analysis, robust inference, and exploratory data … Continued