RJI news
Journalists: If you’ve worked with others to change your newsroom, you’re probably an organizer
Three lessons I’ve learned about journalism, organizing, and how closely intertwined they are.
Addressing the latest wave of coronavirus misinformation
First Draft created a special section on COVID-19 in its Basic Toolkit for verification. ONA quickly published a COVID-19 Misinformation Playbook and SPJ’s Journalist’s Toolbox maintains its own page of resources for fact-checking coronavirus information. Using these guides and a few select tools can help journalists verify facts and fight misinformation.
Epic history that inspired epic storytelling
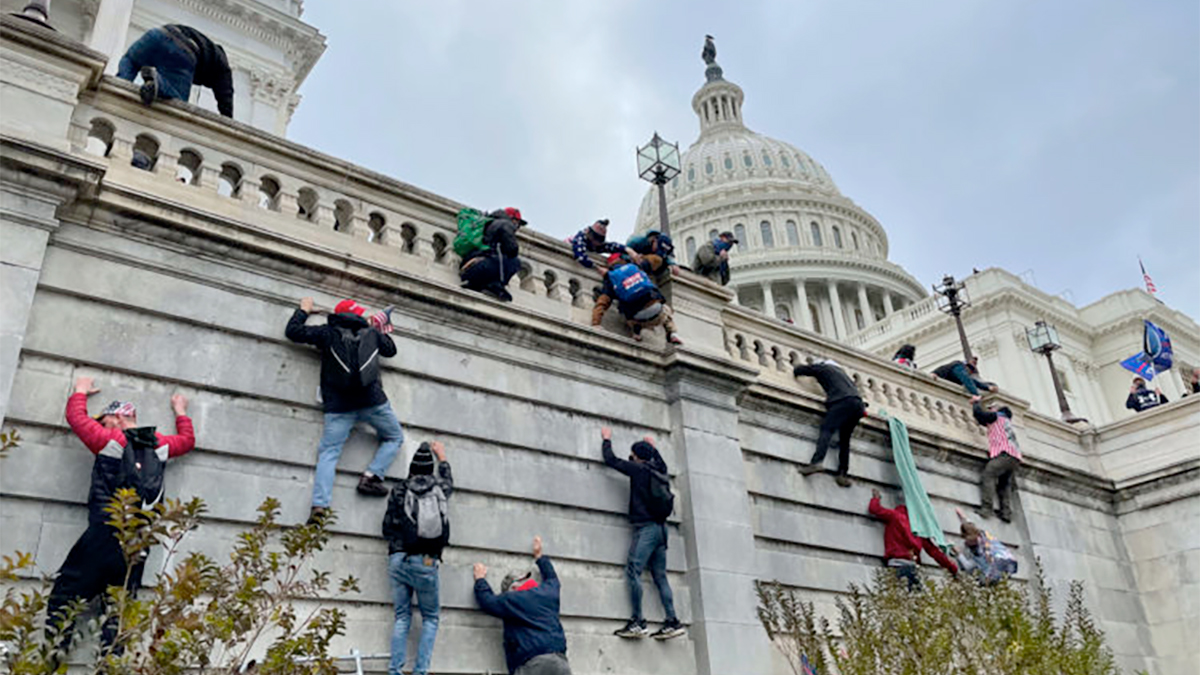
A team from The Washington Post re-reported and retold the Jan. 6, 2021, assault on the U.S. Capitol with classic, credible and compelling journalism.
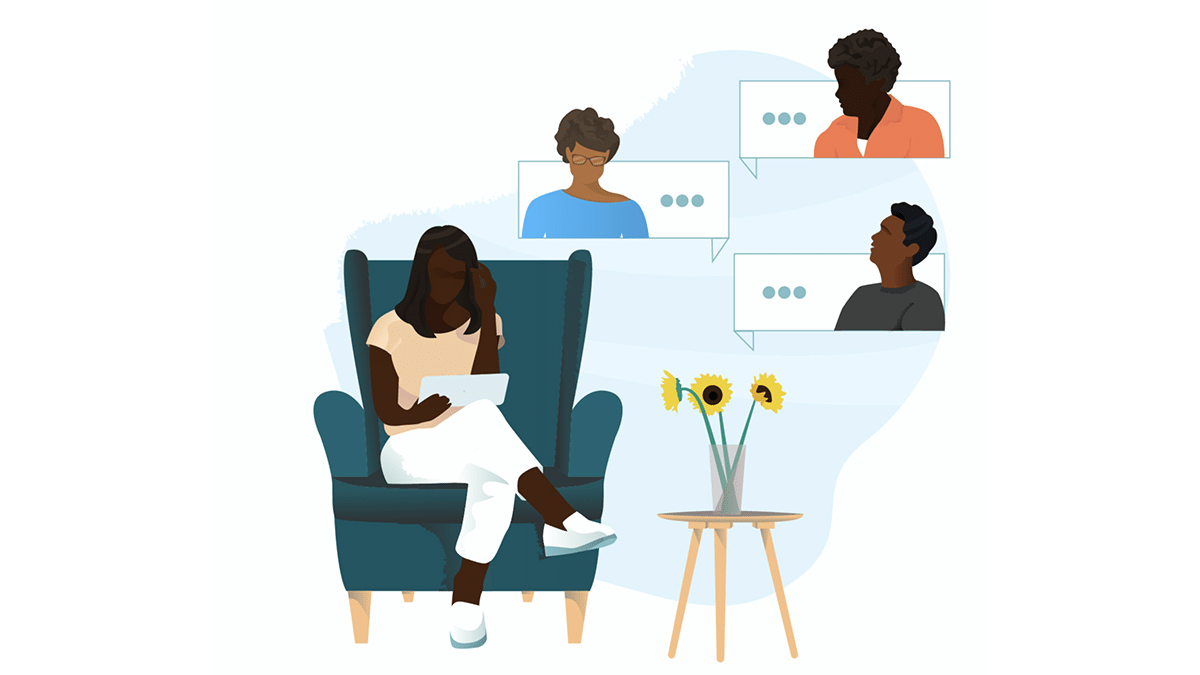
Creating a toolkit for impactful conversations between journalists and the communities they serve
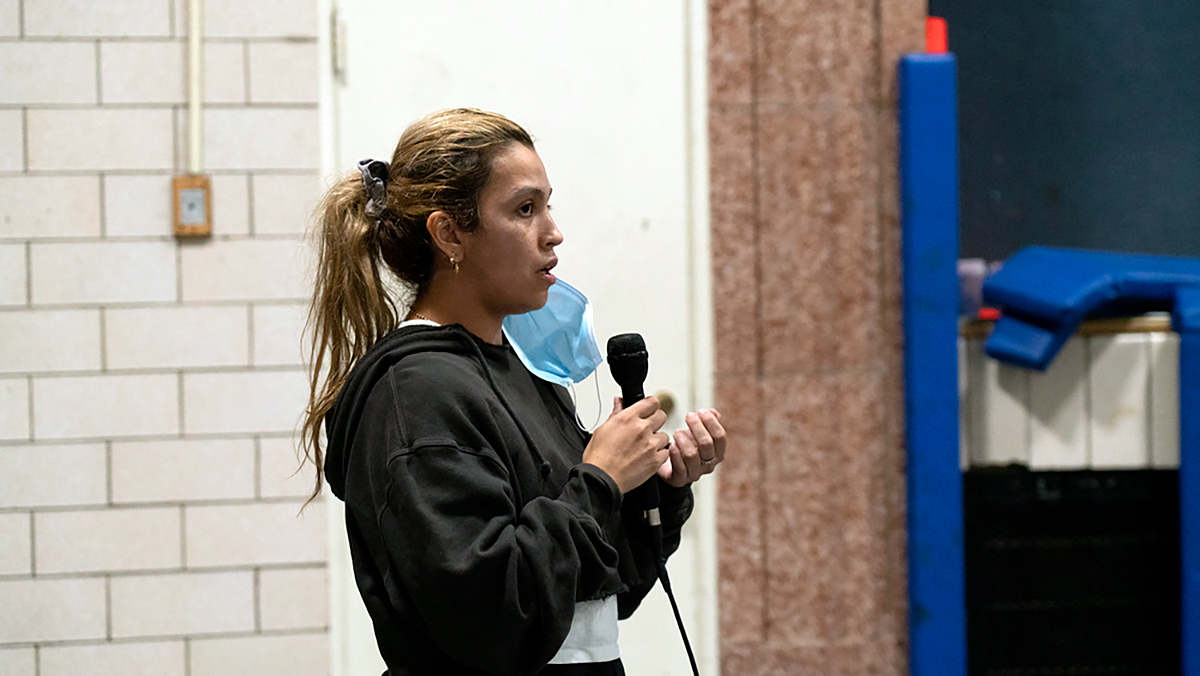
The Covering Your Community project continues with planning for another event in the new year, this one to be held in the Englewood neighborhood of Chicago, a predominantly Black community area with a significant poverty rate.
Q&A: What a newsroom learned switching story budgets to Airtable
Save time, collaborate, integrate with new tools and share records requests.
79th Pictures of the Year International competition now accepting entries
The Missouri School of Journalism’s 79th annual Pictures of the Year International (POY) competition is now accepting entries. The deadline for submissions is Monday, Jan. 17.
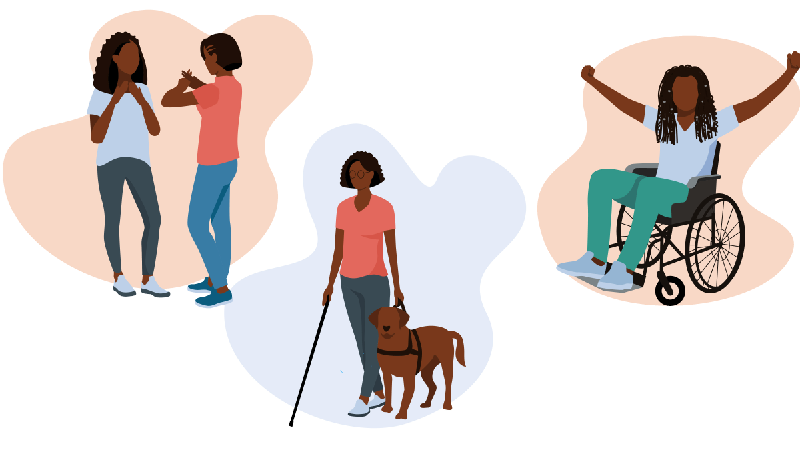
Three disability questions every editor should ask
Accessible editing practices elevate disabled voices, eliminates ableism and makes journalism more accurate.
Reynolds Journalism Institute in 2021: A look back
With the year coming to a close, here’s a look back at the key programs and initiatives made possible by the Reynolds Journalism Institute (RJI) in 2021
Incorporating volunteers to expand football season coverage
We invited freshmen with no journalism experience into our ‘Get in the Game’ initiative Through the Missouri Method, we give students the opportunity to work in real-world newsroom environments. Meanwhile, our One Newsroom outlets are competing for eyeballs in the communities of mid-Missouri. And, like newspapers, magazines and television and radio stations all over the … Continued
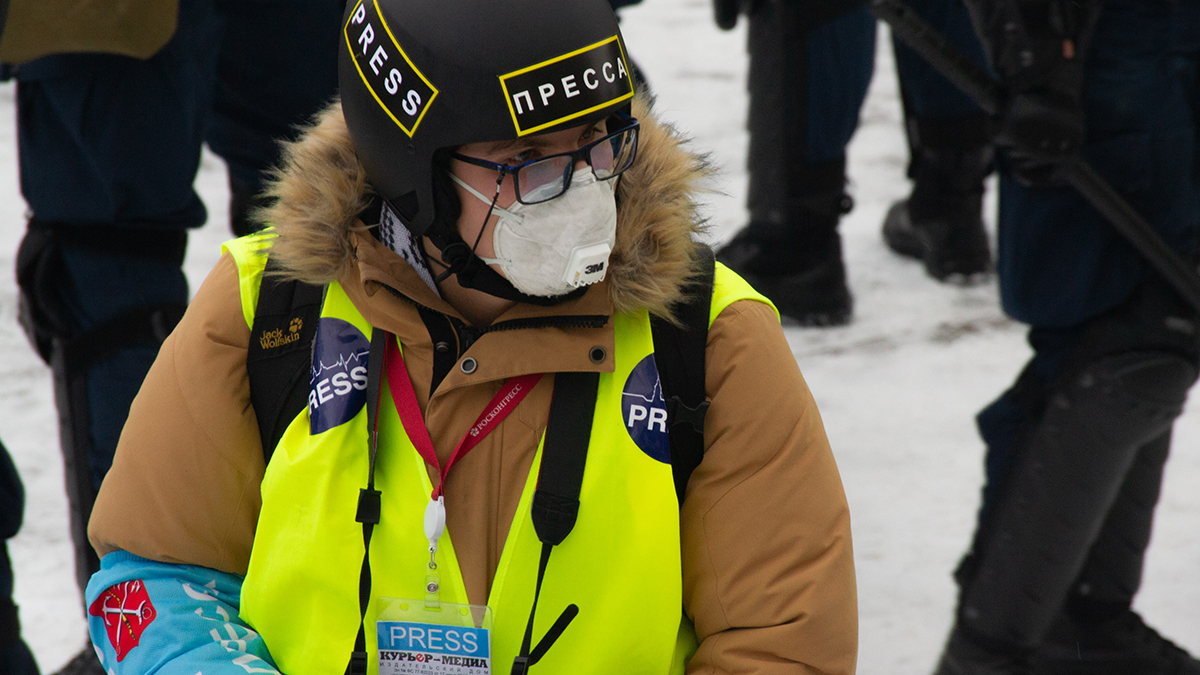
Best practices for trauma-informed journalism
Experts and journalists provide tips to keep yourself and your sources safe.
