Innovation

Q&A: Media reparations with Collette Watson
The views expressed in this column are those of the author and do not necessarily reflect the views of the Reynolds Journalism Institute or the University of Missouri. While Black Americans have held steady conversations for years on how to repair the generational harms enacted by slavery, American institutions have only recently begun to take … Continued
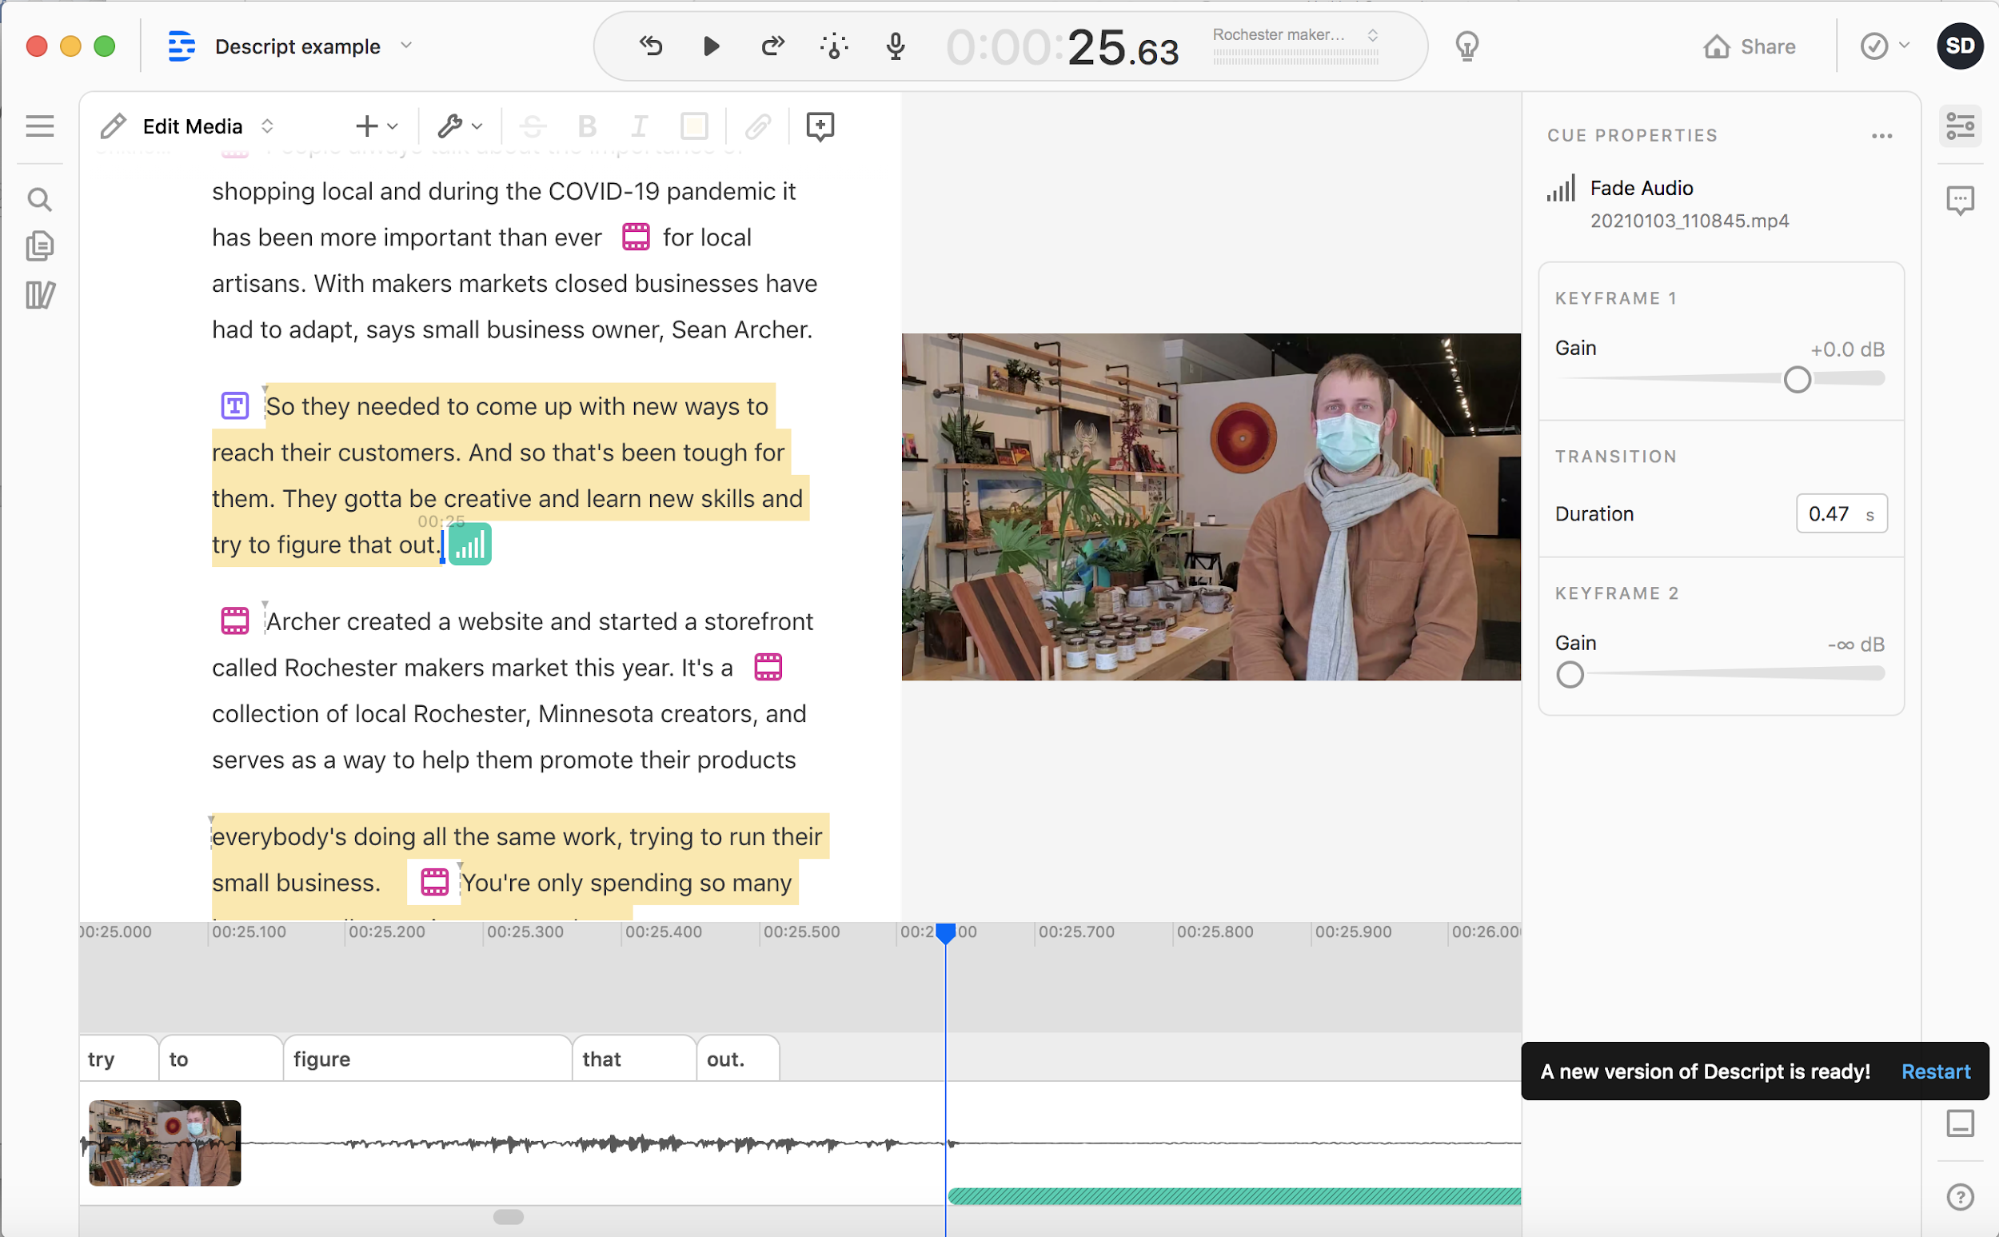
Descript video: Tips and tricks
Innovation in Focus is a series exploring emerging technology and methods of storytelling for newsrooms worldwide. We interview experts, test tools and provide our findings on a different topic each month. This month I tested Descript’s new video editing software to create this video about a local maker and his business. Here are five tips … Continued

From Next City to Next Journalism: Oscar Perry Abello is redefining accountability journalism
Oscar Perry Abello is a New York City-based journalist and senior economics correspondent for Next City, where he covers responses to economic injustice for the non-profit online magazine devoted to inspiring greater economic, environmental, and social justice in cities. I spoke with Abello as part of RJI’s Inclusive Media and Economies project that examines the … Continued

Having a natural curiosity about mundane processes
Data journalism and where it’s headed next Alex Richards is an assistant professor S.I. Newhouse School of Public Communications at Syracuse University. I spoke to him about data journalism and what is in its future. Monnay: Can you describe your history and experience with data journalism? I was a graduate student at the University of … Continued
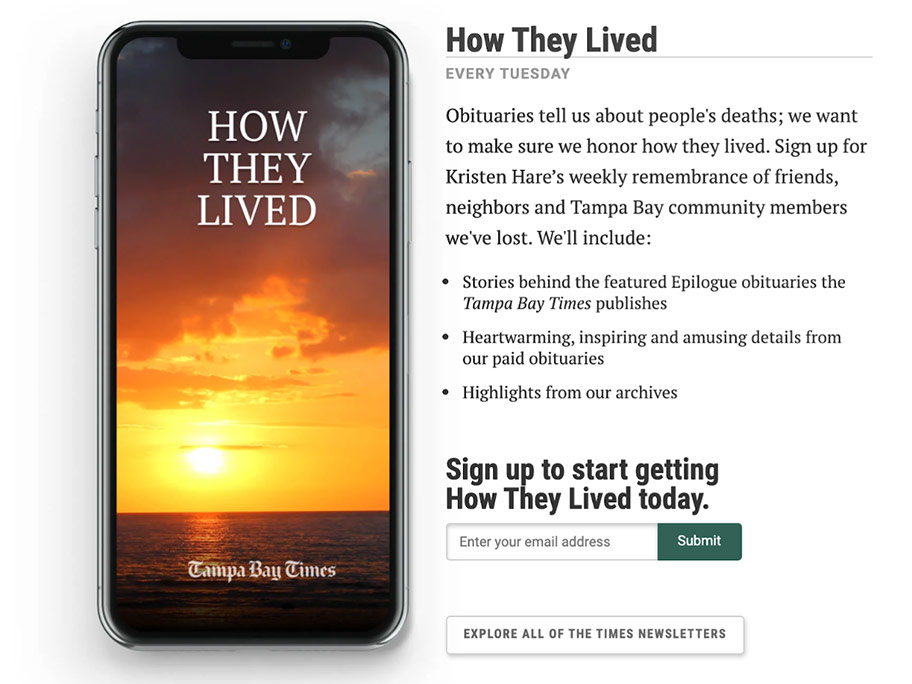
Launching a newsletter and thinking about analytics
It’s not just about clicks When we launched our obits newsletter, How They Lived, on December 8, I had one big concern: Would anyone read it? Honestly, I worry about that with everything I publish, but launching a new product so close to the holidays only amped up that worry. The beauty of making journalism … Continued

Pre-reporting for data journalists
A brief intro to exploratory analysis In a recent paper, a pair of statisticians took a stab at outlining “the most important statistical ideas of the past 50 years.” Among them: “counterfactual causal inference, bootstrapping and simulation-based inference, overparameterized models and regularization, multilevel models, generic computation algorithms, adaptive decision analysis, robust inference, and exploratory data … Continued
Narrated articles: Q&A with Allyson Daniels
This month for Innovation in Focus, I interviewed Allyson Daniels to learn more about how we can increase accessibility in journalism. Daniels is a quality editor for the Bleacher Report. Swanson: Could you give a brief summary of the work you do? Daniels: I’m a quality editor for digital sports media network Bleacher Report, meaning … Continued

Year in review: How RJI continues to work with, and for, journalists
Eight ways RJI helped newsrooms like yours in 2020 It doesn’t happen every year, but when the unexpected discovery becomes a bit of a trend at the Donald W. Reynolds Journalism Institute, it’s a good year. And that it happened in 2020, which, for the most part, has been a tough year, is especially good. … Continued
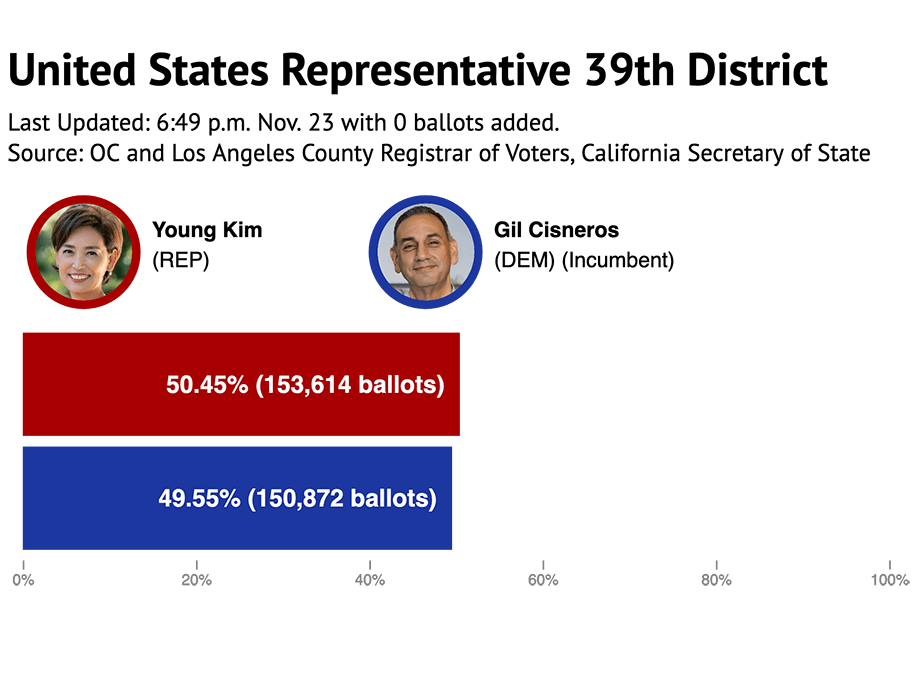
Automating election results from local data sources
We teamed up with the Voice of OC, a non-profit, local news site in Orange County, California, to automate their live election results. We teamed up with the Voice of OC, a non-profit, local news site in Orange County, California, to automate their live election results. By integrating data from several authorities, we provided up-to-the-minute … Continued
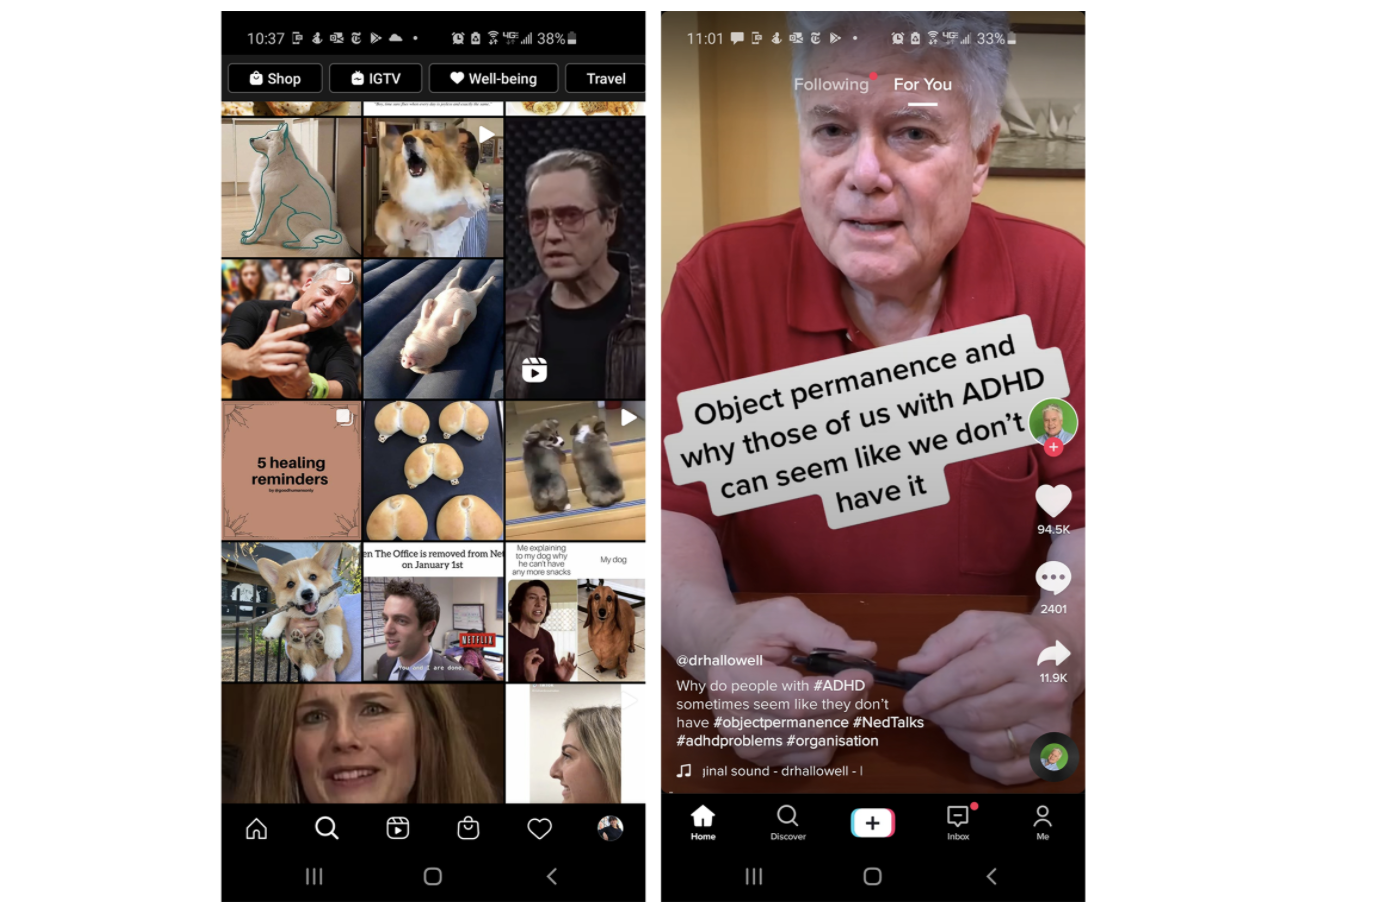
Instagram Reels: Q&A with Anthony Quintano
For Innovation in Focus this month I experimented with Instagram Reels and spoke with social media manager Anthony Quintano about Instagram Reels and how it compares to TikTok so far. He is currently a manager of visual storytelling and has trained journalists on how to use social media since 2010 at NBC, Recode and Honolulu Civil Beat. … Continued