Engagement
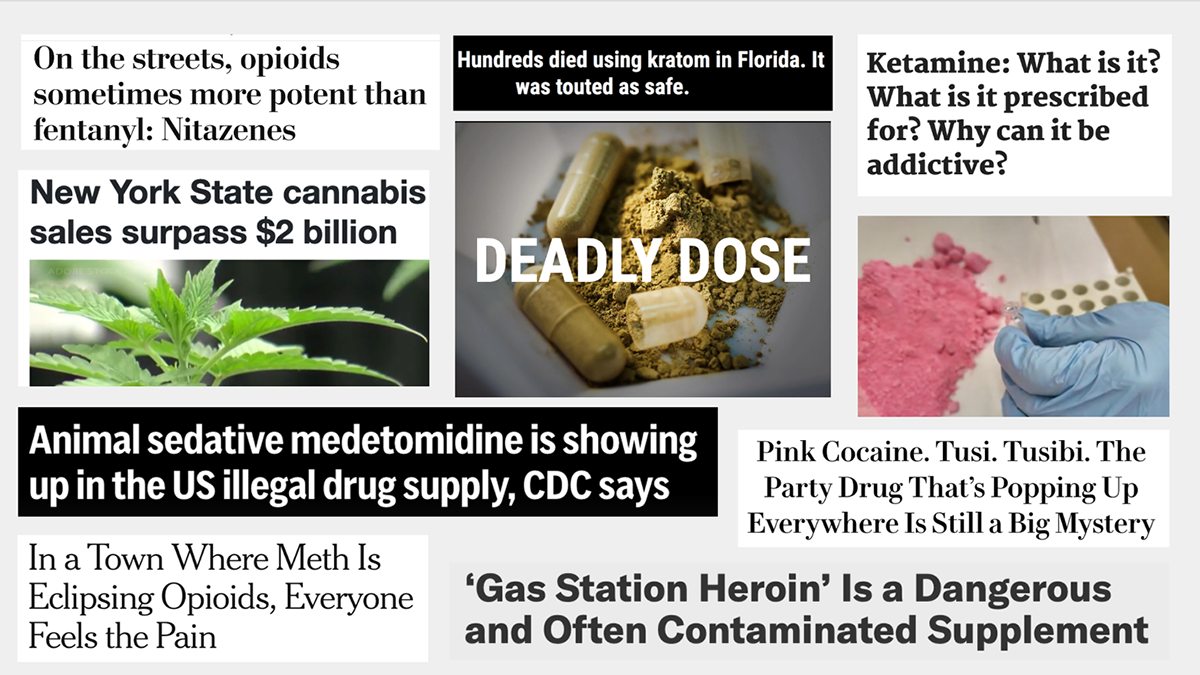
Covering the drug supply, risks and trends
Educating readers, listeners, and viewers about drugs, risks, and their effects—without overstating threats

Report like an anthropologist
From ethnographic interviews to semiotic mapping: Small newsrooms can do big things, you just need the right tools.
Introducing AskRJI, an experimental chatbot
AskRJI places a wealth of knowledge and resources about community journalism at your fingertips.
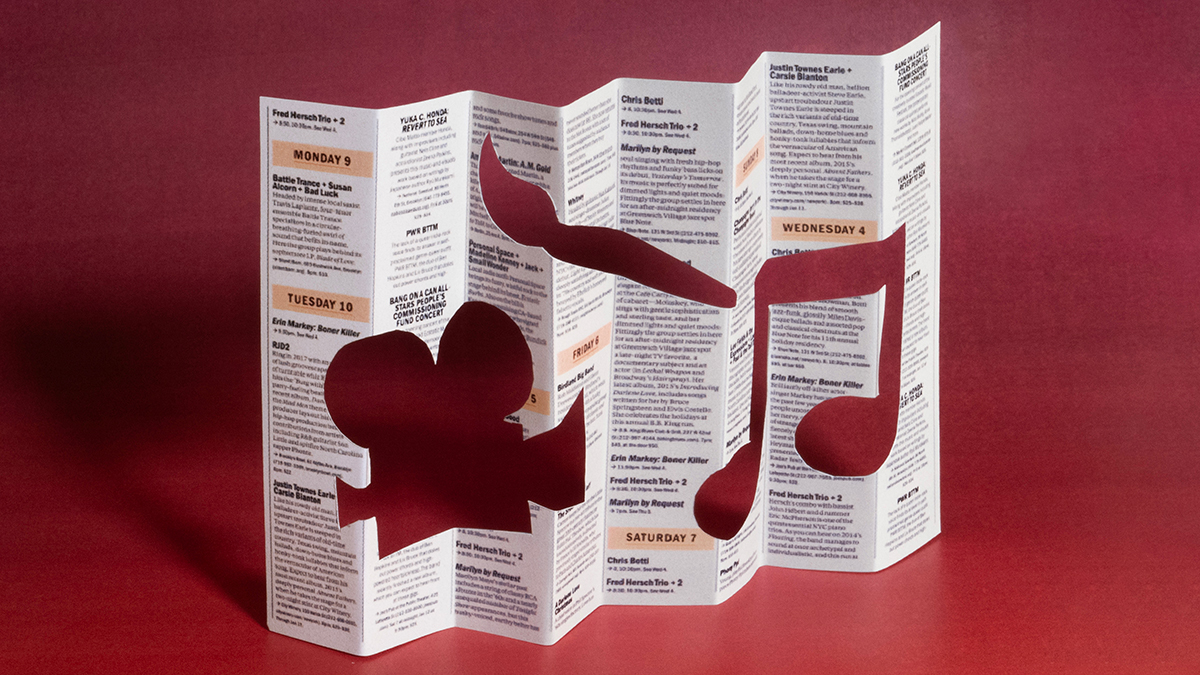
Saving the symbiotic relationship between listings and local arts communities
One musician uses his platform to call for philanthropic renaissance.
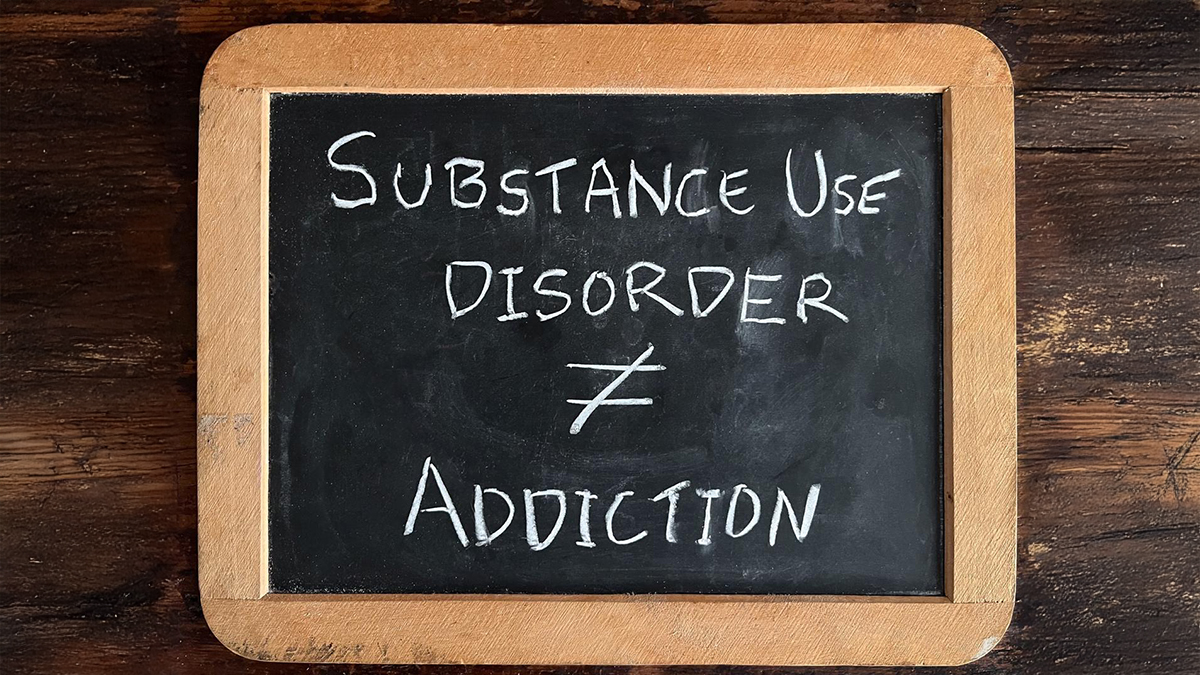
Understanding the difference between substance use disorders and addiction
The distinction is important, but sometimes gets blurred in media coverage.
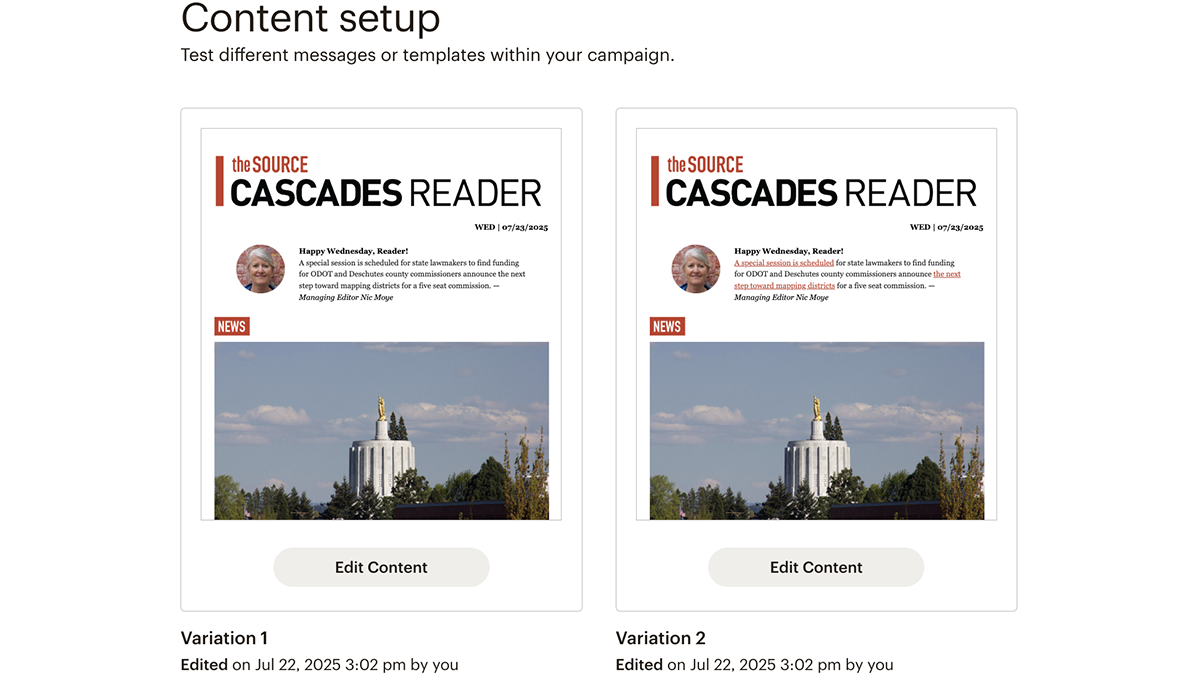
Newsletter A/B tests you can try — and how to set it up
Experimenting by adding links and generating AI summaries for newsletters.

Funding arts journalism’s future
Building a new repository and nonprofit for arts journalism.
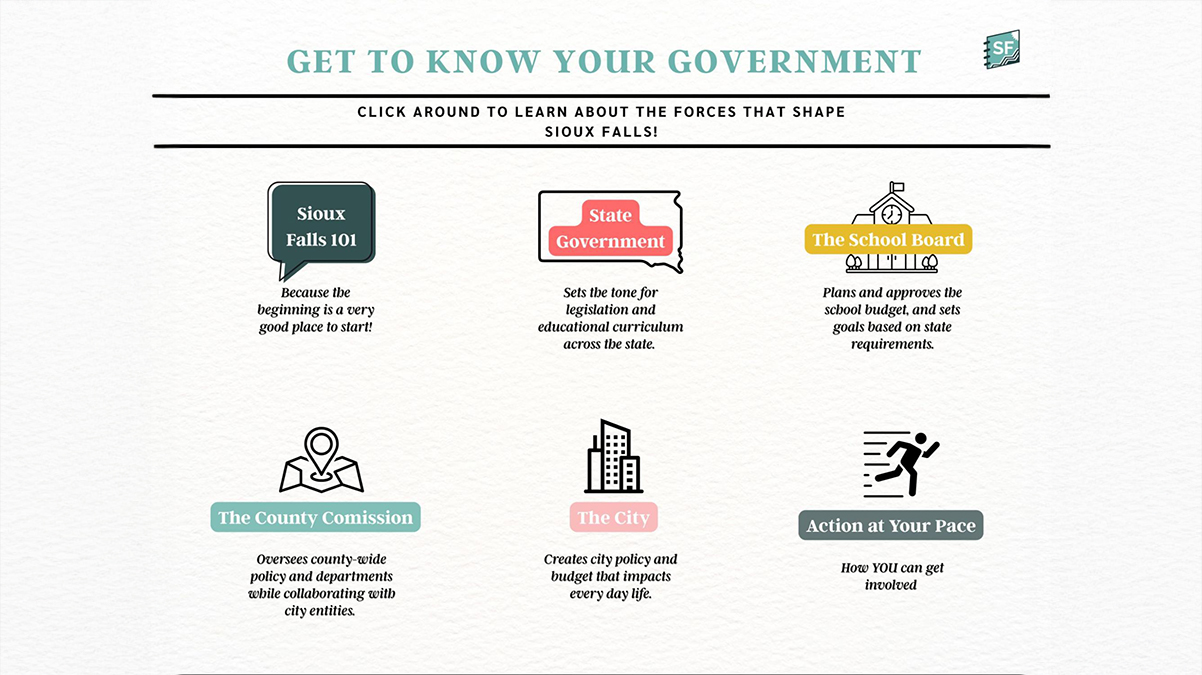
Building a civic health guide that inspires action and education
Lessons learned from creating Sioux Falls 101.
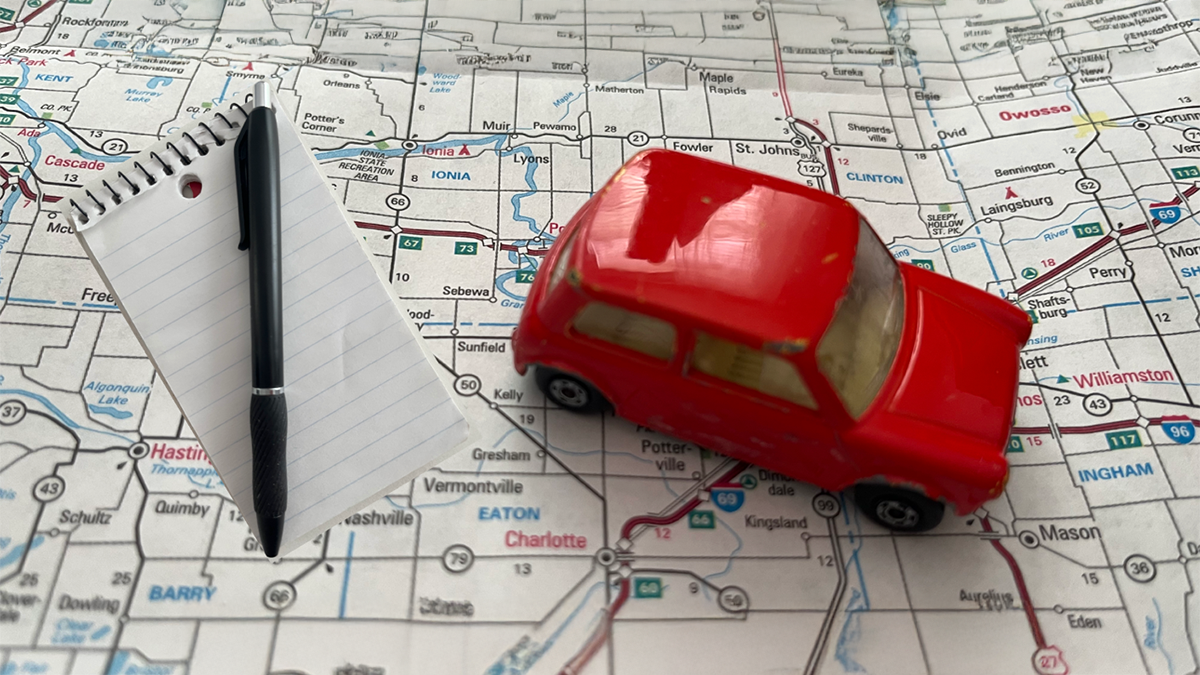
A roadmap to resources for reporting on drugs
Creating a guide to help journalists shift from drug war framing to a health-centered approach.
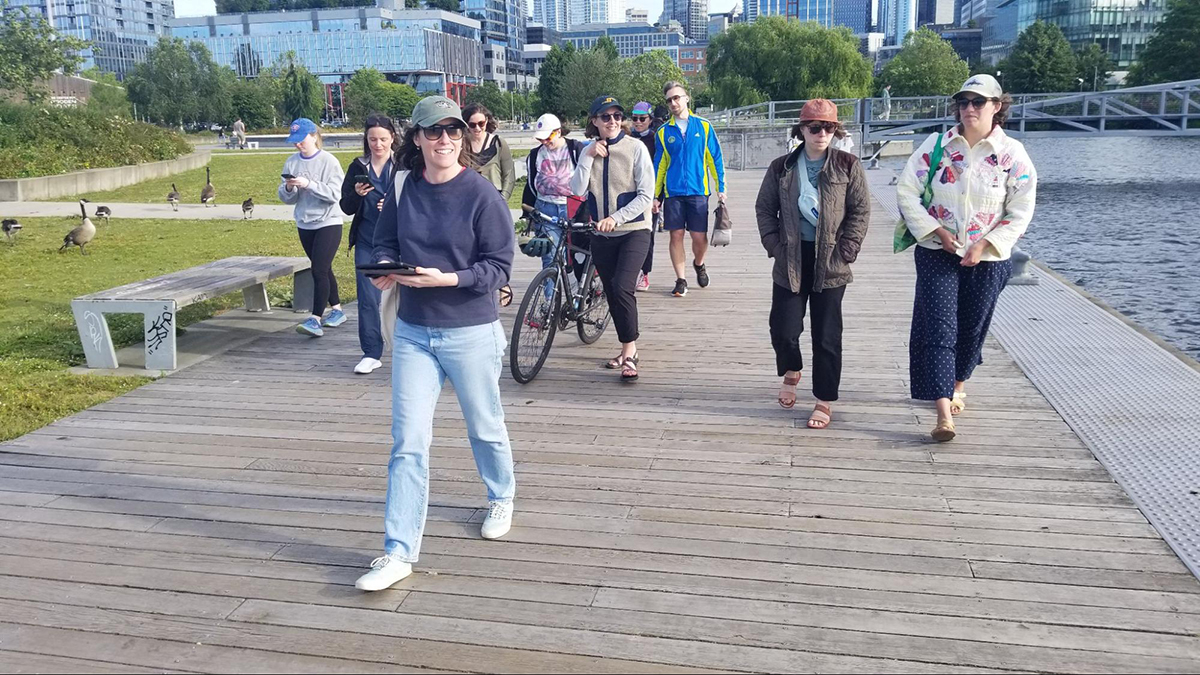
Why walking tours offer another medium for local journalism
Let’s step outside and take a walk with our community.