Engagement
Measuring impact by engaging with readers about your news product
Irina Matchavarini is a 2022 RJI Student Innovation Fellow partnered with the Chicago Reporter and Illinois Latino News in Chicago. The RJI Student Fellows will be sharing their product work throughout the summer in Innovation in Focus. In partnership with the Chicago Reporter and Illinois Latino News — newsrooms covering race, social justice and community … Continued
Why youth media matters
Youth media is an under-tapped approach to addressing some of public media’s biggest challenges.
How to engage your community with Instagram takeovers
Publications are seeing an increase in the amount of audience members because of new engagement strategies in place.
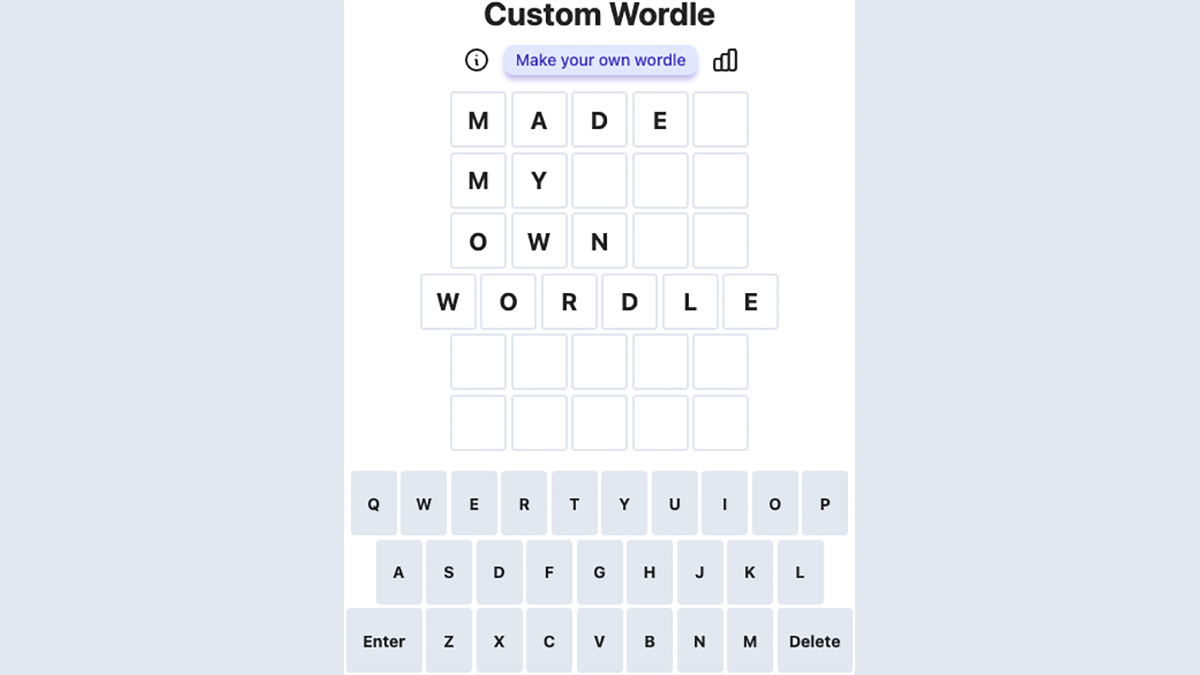
Building minigames for digital engagement
Wordles, Heardles and Absurdles.
Small publishers can build meaningful engagement practices without more time or resources
It will help you serve the people who are most on board with your mission — and most likely to read and need your reporting.
Use audio to promote greater audience engagement
Social media and smartphones have made it easier than ever for newsrooms to encourage, and use, user-generated content.
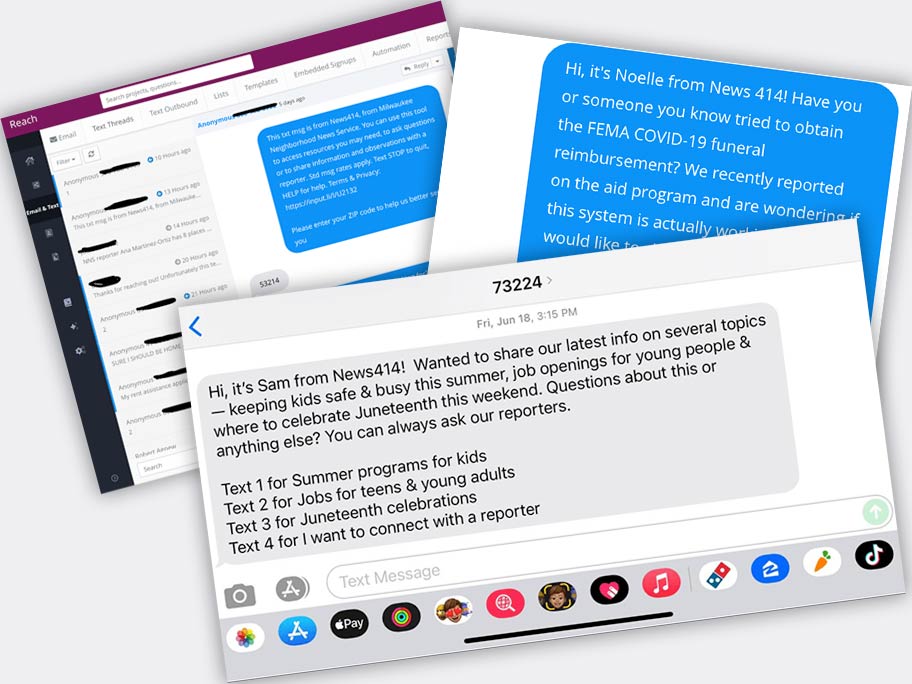
How texting can help boost your service journalism efforts
The Wisconsin Center for Investigative Reporting’s partner, News 414, is trying Public Input to talk to readers and help them find resources for housing, food pantries, or even speak directly to a reporter.
The Uproot Project wants race and class at the forefront of environmental reporting
“The old narrative doesn’t work anymore — it never did. It’s time to take it out by its roots, and start anew.”
9 ways newsrooms can incorporate more audio in their work
The ability to hear stories is essential for visually impaired audiences — and anyone who wants to consume content on the move.
How should publishers change their messaging when paywalls aren’t one size fits all?
Optimizing content limits on a user-by-user basis Should publishers communicate content limits to their audiences? The question becomes more pressing as the products that manage paywalls become sophisticated enough to make predictions about who likely subscribers are. We decided to test this idea with the Reynolds Journalism Institute this year in a partnership project where … Continued

![A photo collage of portraits of the people quoted in this article and photos of radio studio equipment. Top row from left: Kassidy Arena, Caryn Mathes, Elizabeth Gabriel. Bottom row: Doug Mitchell [photo illustration by Halisia Hubbard], a sound board, a microphone, a Tascam audio recorder, Kamna Shastri.](https://rjionline.org/wp-content/uploads/sites/2/2022/08/heiseym22081506.jpg)


